Fig. 4
Download original image
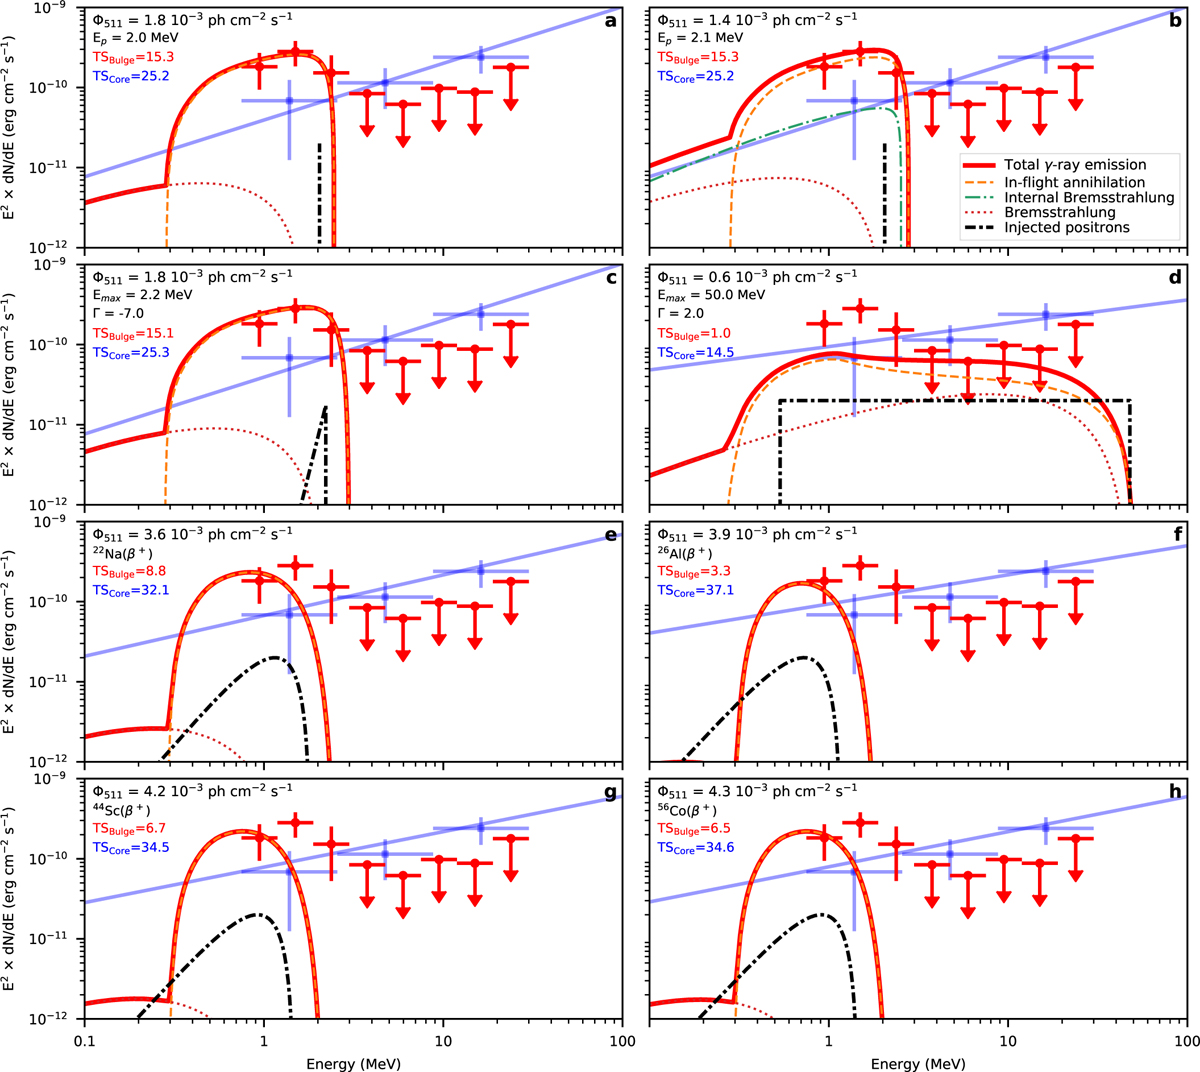
Expected γ-ray spectra for positrons in flight (red lines), including contributions from in-flight annihilation (dashed orange lines), Bremsstrahlung (dotted brown lines), and internal Bremsstrahlung (dash-dotted green line). Positron injection spectra are shown as dash-dotted black lines. Model spectra are shown for stationary injection of mono-energetic positrons (a), dark matter annihilation (b), stationary injection of positrons obeying a power-law spectrum of slope Γ and maximum energy Emax (c, d), and β+ decays of radioactive isotopes (e–h). The power-law spectra of the jointly fitted Core component are shown as light blue lines. The SEDs of the Bulge and Core components, replicated from Fig. 3, are shown as red and light blue data points for visual comparison. Fitted parameters for the Bulge component and TS values for the Bulge and Core components are given in each panel.
Current usage metrics show cumulative count of Article Views (full-text article views including HTML views, PDF and ePub downloads, according to the available data) and Abstracts Views on Vision4Press platform.
Data correspond to usage on the plateform after 2015. The current usage metrics is available 48-96 hours after online publication and is updated daily on week days.
Initial download of the metrics may take a while.