[https://doi.org/10.1051/0004-6361/202348502]
[https://doi.org/10.1051/0004-6361/202348270]
| Issue |
A&A
Volume 700, August 2025
|
|
|---|---|---|
| Article Number | C1 | |
| Number of page(s) | 3 | |
| Section | Planets, planetary systems, and small bodies | |
| DOI | https://doi.org/10.1051/0004-6361/202556327e | |
| Published online | 31 July 2025 | |
Geometric albedo of WASP-12 b and WASP-76 b in the CHEOPS and TESS bandpasses (Corrigendum)
1
Admatis,
5. Kandó Kálmán Street,
3534
Miskolc,
Hungary
2
Aix Marseille Univ, CNRS, CNES, LAM,
38 rue Frédéric Joliot-Curie,
13388
Marseille,
France
3
Astrobiology Research Unit, Université de Liège,
Allée du 6 Août 19C,
4000
Liège,
Belgium
4
Astrophysics Group, Lennard Jones Building, Keele University,
Staffordshire,
ST5 5BG,
UK
5
CFisUC, Departamento de Física,
Universidade de Coimbra,
3004516
Coimbra,
Portugal
6
Cavendish Laboratory,
JJ Thomson Avenue,
Cambridge
CB3 0HE,
UK
7
Center for Space and Habitability, University of Bern,
Gesellschaftsstrasse 6,
3012
Bern,
Switzerland
8
Centre Vie dans l’Univers, Faculté des sciences, Université de Genève,
Quai Ernest-Ansermet 30,
1211
Genève 4,
Switzerland
9
Centre for Exoplanet Science, SUPA School of Physics and Astronomy, University of St Andrews,
North Haugh, St Andrews KY16 9SS,
UK
10
Centre for Mathematical Sciences, Lund University,
Box 118,
22100
Lund,
Sweden
11
Departamento de Astrofisica, Universidad de La Laguna,
Astrofísico Francisco Sanchez s/n,
38206
La Laguna,
Tenerife,
Spain
12
Departamento de Fisica e Astronomia, Faculdade de Ciencias, Universidade do Porto,
Rua do Campo Alegre,
4169-007
Porto,
Portugal
13
Department of Astronomy, Stockholm University,
AlbaNova University Center,
10691
Stockholm,
Sweden
14
Department of Astrophysics, University of Vienna,
Türkenschanzstrasse 17,
1180
Vienna,
Austria
15
Department of Physics, University of Warwick,
Gibbet Hill Road,
Coventry
CV4 7AL,
UK
16
Department of Space, Earth and Environment, Chalmers University of Technology,
Onsala Space Observatory,
43992
Onsala,
Sweden
17
Depto. de Astrofisica, Centro de Astrobiologia (CSIC-INTA),
ESAC campus,
28692
Villanueva de la Cañada (Madrid),
Spain
18
Dipartimento di Fisica e Astronomia “Galileo Galilei”, Università degli Studi di Padova,
Vicolo dell’Osservatorio 3,
35122
Padova,
Italy
19
Dipartimento di Fisica, Università degli Studi di Torino,
via Pietro Giuria 1,
10125
Torino,
Italy
20
ELTE Eötvös Loránd University, Gothard Astrophysical Observatory,
9700 Szombathely, Szent Imre h. u. 112,
Hungary
21
ELTE Eötvös Loránd University, Institute of Physics,
Pázmány Péter sétány 1/A,
1117
Budapest,
Hungary
22
ETH Zurich, Department of Physics,
Wolfgang-Pauli-Strasse 2,
8093
Zurich,
Switzerland
23
European Space Agency (ESA), ESTEC,
Keplerlaan 1,
2201
AZ
Noordwijk,
The Netherlands
24
European Space Agency (ESA), European Space Research and Technology Centre (ESTEC),
Keplerlaan 1,
2201
AZ
Noordwijk,
The Netherlands
25
HUN-REN-ELTE Exoplanet Research Group,
Szent Imre h. u. 112.,
Szombathely
9700,
Hungary
26
IMCCE, UMR8028 CNRS, Observatoire de Paris, PSL Univ., Sorbonne Univ.,
77 av. Denfert-Rochereau,
75014
Paris,
France
27
INAF, Osservatorio Astrofisico di Catania,
Via S. Sofia 78,
95123
Catania,
Italy
28
INAF, Osservatorio Astrofisico di Torino,
Via Osservatorio, 20,
10025
Pino Torinese To,
Italy
29
INAF, Osservatorio Astronomico di Padova,
Vicolo dell’Osservatorio 5,
35122
Padova,
Italy
30
Institut d’astrophysique de Paris, UMR7095 CNRS, Université Pierre & Marie Curie,
98bis blvd. Arago,
75014
Paris,
France
31
Institut de Ciencies de l’Espai (ICE, CSIC), Campus UAB,
Can Magrans s/n,
08193
Bellaterra,
Spain
32
Institut d’Estudis Espacials de Catalunya (IEEC),
Gran Capità 2-4,
08034
Barcelona,
Spain
33
Institut fuer Geologische Wissenschaften, Freie Universitaet Berlin,
Maltheserstrasse 74-100,
12249
Berlin,
Germany
34
Institute for Theoretical Physics and Computational Physics, Graz University of Technology,
Petersgasse 16,
8010
Graz,
Austria
35
Institute of Astronomy, University of Cambridge,
Madingley Road,
Cambridge,
CB3 0HA,
UK
36
Institute of Optical Sensor Systems, German Aerospace Center (DLR),
Rutherfordstrasse 2,
12489
Berlin,
Germany
37
Institute of Space Research, German Aerospace Center (DLR),
Rutherfordstrasse 2,
12489
Berlin,
Germany
38
Instituto de Astrofisica de Canarias,
Via Lactea s/n,
38200
La Laguna,
Tenerife,
Spain
39
Instituto de Astrofisica e Ciencias do Espaco, Universidade do Porto, CAUP,
Rua das Estrelas,
4150-762
Porto,
Portugal
40
Konkoly Observatory, Research Centre for Astronomy and Earth Sciences,
1121
Budapest,
Konkoly Thege Miklós út 15-17,
Hungary
41
Leiden Observatory, University of Leiden,
PO Box 9513,
2300
RA Leiden,
The Netherlands
42
Max Planck Institute for Extraterrestrial Physics,
Gießenbachstraße,
85748
Garching,
Germany
43
Observatoire astronomique de l’Université de Genève,
Chemin Pegasi 51,
1290
Versoix,
Switzerland
44
Physikalisches Institut, University of Bern,
Gesellschaftsstrasse 6,
3012
Bern,
Switzerland
45
Space Research Institute, Austrian Academy of Sciences,
Schmiedlstrasse 6,
8042
Graz,
Austria
46
Space sciences, Technologies and Astrophysics Research (STAR) Institute, Université de Liège,
Allée du 6 Août 19C,
4000
Liège,
Belgium
47
Université Grenoble Alpes, CNRS,
IPAG,
38000
Grenoble,
France
48
Université de Paris Cité, Institut de physique du globe de Paris, CNRS,
1 Rue Jussieu,
75005
Paris,
France
49
Weltraumforschung und Planetologie, Physikalisches Institut, University of Bern,
Gesellschaftsstrasse 6,
3012
Bern,
Switzerland
50
German Aerospace Center (DLR),
Markgrafenstrasse 37,
10177
Berlin,
Germany
* Corresponding authors: This email address is being protected from spambots. You need JavaScript enabled to view it.
; This email address is being protected from spambots. You need JavaScript enabled to view it.
; This email address is being protected from spambots. You need JavaScript enabled to view it.
Key words: techniques: photometric / planets and satellites: atmospheres / planets and satellites: composition / errata, addenda
This is a corrigendum to Akinsanmi et al. (2024) and Demangeon et al. (2024). The retrieval code used in these works omitted a factor of λ in the integration of the stellar ( ) and planetary emission (
 ) necessary to obtain the planet-to-star flux ratio (Fd/F*) at each observing band of the atmospheric retrievals (see, for example, Eq. (13) of Akinsanmi et al. 2024). The λ factor is needed because the passband response functions (
 ) are photon counters. The corrected calculation of the thermal planet-to-star flux ratio is
 (1)
where Rp and R* are the planet and star radii.
(1)
where Rp and R* are the planet and star radii.
However, we note that the general analysis, results, and conclusions of the articles are not affected by this error. The omission of the λ factors is only relevant for broad bands and when the emission spectra vary significantly over the bands. This means that in our analyses, only the CHEOPS (CHaracterising ExOPlanet Satellite, Benz et al. 2021) and TESS (Transiting Exoplanet Survey Satellite, Ricker et al. 2015) bands were significantly affected. The revised values, tables, and figures are given below.
1 WASP-12 b
In Akinsanmi et al. (2024), the atmospheric retrievals only included infrared eclipse observations as constraints (Sect. 5.2.1). Thus, the retrieval results were not affected in a statistically significant manner. We confirmed this by re-running the analysis with the corrected passband calculation.
The thermal contributions inferred from the retrieval to the eclipse depths in the CHEOPS and TESS passbands are revised from 205 ± 10 and 480 ± 19 ppm (Sect. 5.3) to 270 ± 11 and 511 ± 18 ppm, respectively. This led to updated geometric albedos, from Ag = 0.083 ± 0.015 and 0.010 ± 0.023 to Ag = 0.042 ± 0.018 and −0.010 ± 0.024 in the CHEOPS and TESS bands, respectively. This correction does not alter our general conclusion that WASP-12 b has a low geometric albedo, which is consistent with the low reflectivity observed in other ultra-hot Jupiters.
2 WASP-76 b
Similarly to what was done for WASP-12 b, the atmospheric retrievals of WASP-76 b performed in Demangeon et al. (2024) only included the infrared eclipse observations as constraints (Sect. 5.1.1). The retrieval results were thus not affected in a statistically significant manner. The retrieval-inferred thermal eclipse depths over the CHEOPS and TESS bands have increased from their original values. Figure 1 shows the corrected band-integrated eclipse depths inferred from each retrieval model (correction of the insets in Figs. 4 and C1 of Demangeon et al. 2024). Table 1 shows the corrected geometric albedos (correction of Table 3 of Demangeon et al. 2024). This correction (lower geometric albedo values) does not change the conclusions (Sect. 6.1 of Demangeon et al. 2024), that WASP-76b has a low geometric albedo, consistent with that of other ultra-hot Jupiters. Taking the different composition hypotheses and the different reductions of the infrared datasets into account, we can set a 1-sigma upper limit of 0.13 and 0.19 in the CHEOPS and TESS bandpasses, respectively (correction of the values provided in Table 6).
WASP-76b’s Ag estimates.
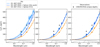 |
Fig. 1 Corrected reproduction of the insets of Figs. 4 and C1 of Demangeon et al. (2024): WASP-76 b occultation atmospheric retrievals for a model including the TiO and VO optical absorbers (left panel), including only VO (middle), and excluding both TiO and VO (right). The light blue, dark blue, and orange curves and their associated shaded areas show the retrieved spectra and 68% credible intervals when fitting the D1, D2, and D3 occultation observations, respectively (see the legend and notes in Table 1). The grey markers show the CHEOPS and TESS occultation measurements, although the fits are not constrained by these observations. The coloured square markers show the corrected model eclipse-depths integrated over the CHEOPS and TESS bands (see the passband response functions in grey at the bottom of the panels). |
References
- Akinsanmi, B., Barros, S. C. C., Lendl, M., et al. 2024, A&A, 685, A63 [NASA ADS] [CrossRef] [EDP Sciences] [Google Scholar]
- Benz, W., Broeg, C., Fortier, A., et al. 2021, Exp. Ast., 51, 109 [Google Scholar]
- Demangeon, O. D. S., Cubillos, P. E., Singh, V., et al. 2024, A&A, 684, A27 [NASA ADS] [CrossRef] [EDP Sciences] [Google Scholar]
- Edwards, B., Changeat, Q., Baeyens, R., et al. 2020, AJ, 160, 8 [Google Scholar]
- Fu, G., Deming, D., Lothringer, J., et al. 2021, AJ, 162, 108 [NASA ADS] [CrossRef] [Google Scholar]
- Ricker, G. R., Winn, J. N., Vanderspek, R., et al. 2015, J. Astron. Teles. Instrum. Syst., 1, 014003 [Google Scholar]
© The Authors 2025
 Open Access article, published by EDP Sciences, under the terms of the Creative Commons Attribution License (https://creativecommons.org/licenses/by/4.0), which permits unrestricted use, distribution, and reproduction in any medium, provided the original work is properly cited.
This article is published in open access under the Subscribe to Open model. This email address is being protected from spambots. You need JavaScript enabled to view it. to support open access publication.
All Tables
All Figures
|
Fig. 1 Corrected reproduction of the insets of Figs. 4 and C1 of Demangeon et al. (2024): WASP-76 b occultation atmospheric retrievals for a model including the TiO and VO optical absorbers (left panel), including only VO (middle), and excluding both TiO and VO (right). The light blue, dark blue, and orange curves and their associated shaded areas show the retrieved spectra and 68% credible intervals when fitting the D1, D2, and D3 occultation observations, respectively (see the legend and notes in Table 1). The grey markers show the CHEOPS and TESS occultation measurements, although the fits are not constrained by these observations. The coloured square markers show the corrected model eclipse-depths integrated over the CHEOPS and TESS bands (see the passband response functions in grey at the bottom of the panels). |
| In the text | |
Current usage metrics show cumulative count of Article Views (full-text article views including HTML views, PDF and ePub downloads, according to the available data) and Abstracts Views on Vision4Press platform.
Data correspond to usage on the plateform after 2015. The current usage metrics is available 48-96 hours after online publication and is updated daily on week days.
Initial download of the metrics may take a while.