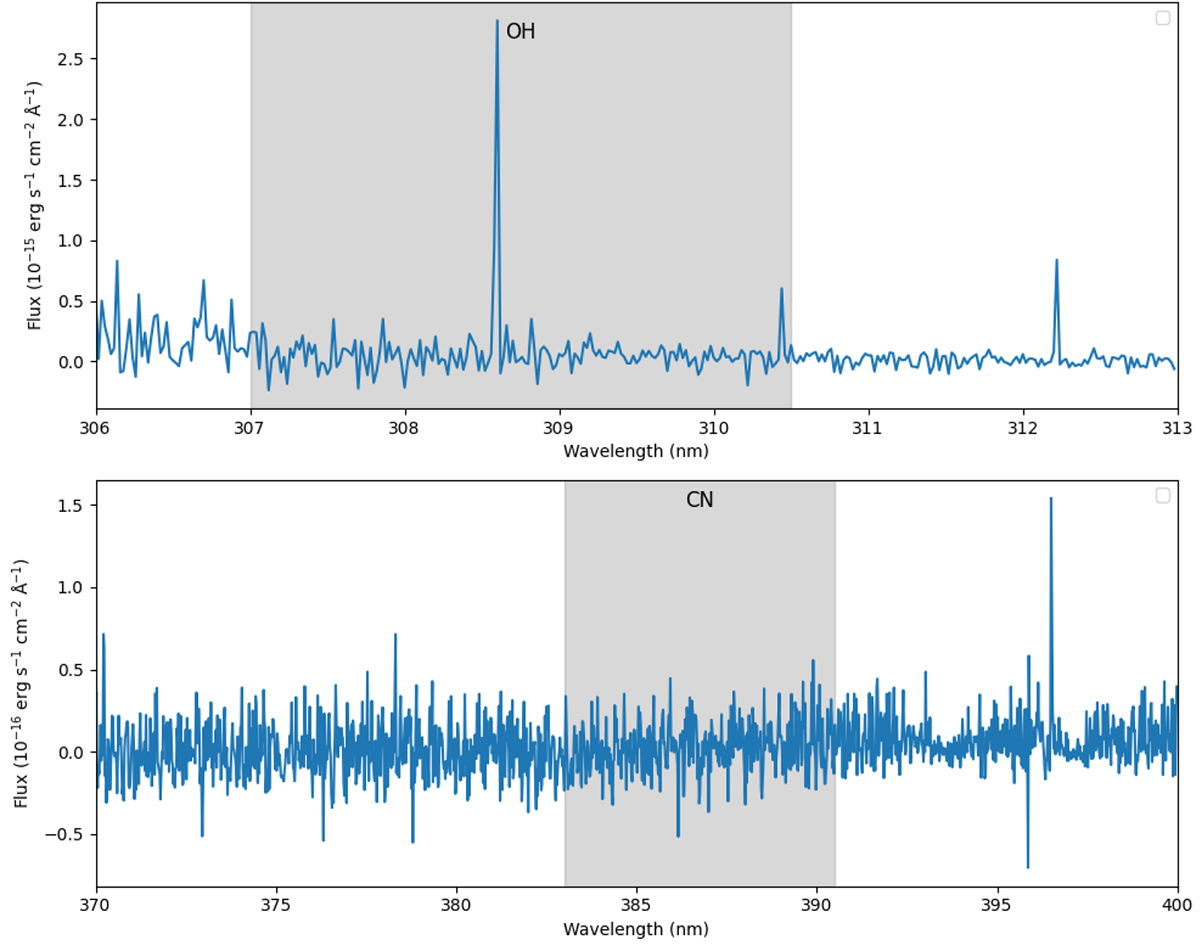
Fig. 2.
Download original image
Spectrum of 3I/ATLASafter the solar signature was removed, showing the wavelength ranges in which the gas emission bands should appear above the noise level. Top: OH region. The three apparent emission lines are hot pixels that remained from the data reduction and are not real emission lines within the OH band. Bottom: CN region and two adjacent continua.
Current usage metrics show cumulative count of Article Views (full-text article views including HTML views, PDF and ePub downloads, according to the available data) and Abstracts Views on Vision4Press platform.
Data correspond to usage on the plateform after 2015. The current usage metrics is available 48-96 hours after online publication and is updated daily on week days.
Initial download of the metrics may take a while.