| Issue |
A&A
Volume 700, August 2025
|
|
|---|---|---|
| Article Number | L10 | |
| Number of page(s) | 4 | |
| Section | Letters to the Editor | |
| DOI | https://doi.org/10.1051/0004-6361/202556338 | |
| Published online | 05 August 2025 | |
Letter to the Editor
X-SHOOTER spectrum of comet 3I/ATLAS: Insights into a distant interstellar visitor
Instituto de Astrofísica de Andalucía – Consejo Superior de Investigaciones Científicas (IAA-CSIC), Glorieta de la Astronomía S/N, E-18008 Granada, Spain
⋆ Corresponding author.
Received:
9
July
2025
Accepted:
25
July
2025
Abstract
Context. Comets are primitive remnants of the early Solar System whose composition offers fundamental clues to their formation and evolution. High-resolution broad-wavelength spectroscopy is crucial for identifying volatile species and constraining the physical conditions within the coma.
Aims. We characterize the gas composition and physical environment of the newly discovered comet 3I/ATLAS through optical and near-infrared spectroscopy.
Methods. We used a medium-resolution spectrum of comet 3I/ATLAS with X-shooter at the ESO Very Large Telescope that covers the 300–2500 nm wavelength range. Standard data reduction and flux calibration were applied.
Results. Although the object is clearly active, only upper limits to the production rates of OH and CN can be estimated: 8.2 × 1026 s−1 and 5.6 × 10²³ s−1, respectively. We obtained red spectral slopes consistent with those of typical D-type asteroids and objects in the outer Solar System.
Key words: methods: observational / techniques: spectroscopic / comets: individual: 3I/ATLAS
© The Authors 2025
 Open Access article, published by EDP Sciences, under the terms of the Creative Commons Attribution License (https://creativecommons.org/licenses/by/4.0), which permits unrestricted use, distribution, and reproduction in any medium, provided the original work is properly cited.
This article is published in open access under the Subscribe to Open model. This email address is being protected from spambots. You need JavaScript enabled to view it. to support open access publication.
1. Introduction
Interstellar objects are defined as bodies that are not gravitationally bound to the Sun. The first such object that was discovered to pass through our Solar System was 1I/’Oumuamua (1I/2017 U1). It was detected in 2017 by Robert Weryk using the Panoramic Survey Telescope and Rapid Response System (Pan-STARRS) telescope at the Haleakalō Observatory in Hawaii. ’Oumuamua is a small object with highly variable light curves that suggest an extremely elongated shape (Jewitt et al. 2017), possibly more so than in any other known Solar System object. It displays a reddish color (Ye et al. 2017), similar to bodies in the outer Solar System. Despite its close perihelion passage, ’Oumuamua showed no detectable coma (Jewitt et al. 2017), although a nongravitational acceleration was measured that might have resulted from outgassing or solar radiation pressure (Micheli et al. 2018).
The second confirmed interstellar object was 2I/Borisov. It was originally designated C/2019 Q4 (Borisov). 2I/Borisov was discovered on August 29, 2019, by Gennadiy Borisov in Crimea. Unlike ‘Oumuamua, 2I/Borisov showed clear cometary activity (Opitom et al. 2019), with a visible coma and tail. Its perihelion was at 2.006 AU, and its eccentricity was 3.357. Its diameter was estimated to be < 0.5 km based on a typical cometary albedo (Jewitt & Luu 2019; Guzik et al. 2020).
A new interstellar visitor, 3I/ATLAS (provisionally designated A11pl3Z), was discovered on July 1, 2025, by the Asteroid Terrestrial-impact Last Alert System (ATLAS) survey at a heliocentric distance of 4.53 AU. Precovery observations from June 14 revealed an extremely high eccentricity (∼6.0), nearly twice that of 2I/Borisov, which is the most eccentric interstellar object known to date. This strongly supports that it has an extrasolar origin (Seligman et al. 2025). The object was bright enough (V ≈ 18.1) and displays signs of cometary activity, including a detectable coma (Jewitt & Luu 2025; Alarcon et al. 2025).
It is essential to understand the surface composition of interstellar objects (ISOs) to constrain their thermal and dynamical histories, and also their potential connections to small-body populations in other planetary systems (Seligman & Moro-Martín 2022). These objects may preserve primitive materials that formed around other stars, which provides a rare opportunity to probe the diversity of planetary formation environments beyond our own Solar System.
Spectroscopy across a broad wavelength range from the near-ultraviolet to the near-infrared makes it possible to detect absorption features associated with specific ices (e.g., H2O), organic compounds, and surface alteration processes (Jewitt 2024). It also provides insight into the effects of a prolonged exposure to interstellar radiation and cosmic rays, and early signs of activity induced by solar heating can be detected (Guzik et al. 2020). By comparing the spectral properties of ISOs with those of comets, asteroids, and trans-Neptunian objects in the Solar System, we can investigate whether similar chemical and physical processes operate universally or differ markedly across stellar systems.
Since its discovery, 3I/ATLAS has gathered widespread attention from the community. Seligman et al. (2025) showed a red photo-spectrum, with a spectral slope (S′) of about 20%/1000 Å (visually estimated from their Fig. 6), with an estimated magnitude variation smaller than 0.2 mag in a time span of 29 h, and an estimated diameter of about 10 km. Interestingly, Bolin et al. (2025) measured solar colors (or an almost neutral S′), while Opitom et al. (2025) obtained a spectrum with a red slope, of about 20%/ 1000 Å. Hopkins et al. (2025) suggested that 3I/ATLAS may have originated within the thick disk of the Milky Way.
In this work, we present the spectroscopic observations of comet 3I/ATLAS that were obtained with the X-SHOOTER instrument mounted on the European Southern Observatory (ESO) Very Large Telescope (VLT). This dataset provides a unique simultaneous view across the ultraviolet, visible, and near-infrared spectral domains. These observations represent a significant step forward in characterizing dynamically new comets. The acquisition of spectra at this early stage offers a valuable baseline before the onset of intense solar-driven evolution and enhances the scientific relevance of the dataset. This work is organized as follows: Section 2 describes the data reduction, and Section 3 presents the analysis and discussion of the results. The last section presents our conclusions.
2. Observations and data reduction
We used the spectra of the interstellar object 3I/ATLAS that were obtained on two nights: on July 4, 2025, between 06:02 and 07:00 UT, and on July 5, between 01:50 and 02:27 UT. The instrument we used was X-SHOOTER, which is mounted on Unit 3 of the VLT. The observations were conducted in service mode under the Director’s Discretionary Time (DDT) program 115.29F3.001 (PI: Puzia); the data are nonproprietary and publicly available to the scientific community. The spectrograph simultaneously covers the full 300–2500 nm spectral range by splitting the incoming light from the telescope into three separate arms using two dichroic filters. The instrument setup is listed below,
Observations were made using generic offsets to facilitate the subsequent estimation and subtraction of the sky signal. A detailed description of the instrument is available at Vernet et al. (2011). In total, six spectra were obtained (three per night). At the time of observation, the visibility was excellent (the seeing was lower than 1″) and the sky conditions were photometric. During the first night, the acquired spectrum captured only light from 3I/ATLAS because the object was relatively isolated in the field. In the second night, however, the field was more crowded, but this did not hinder us in acquiring the long-slit spectrum. Nevertheless, the acquisition images show that the object was free from obvious contamination by background objects.
To reduce the X-SHOOTER spectra, we first processed the data through the ESO esoreflex pipeline version 2.1.91. The pipeline removes the instrument signature, that is, the data are debiased, flat-fielded, wavelength-calibrated, order-merged, extracted, sky-subtracted, and finally, flux-calibrated. This rendered 2D spectra of 3I/ATLAS that were combined to increase the signal-to-noise ratio after centering them on the comet nucleus (i.e., the optocenter). The whole process relies on daily and ancillary calibration files. We used our tools to extract the final 1D spectra from the 2D images.
The observational strategy did not include observations of a solar analog star to remove the solar signature. To analyze the refractory component of the coma, we therefore used the solar spectrum provided by the LASP Interactive Solar Irradiance Datacenter (LISIRD) database2, which is based on the Total and Spectral Solar Irradiance Sensor (TSIS-1 SIM) instrument. We retrieved solar irradiance data for the week of June 7–13, 2025, which were the most recent data available at the time of our analysis. This period is particularly relevant because the Sun is currently near its activity maximum (maximum of solar cycle 25, which began in December 2019), and solar conditions that closely match those during the observation are therefore essential.
Then, we averaged these daily solar spectral irradiance values (in W m−2 nm−1) over these seven days and converted the result into the solar flux as observed at 4.37 au. This was the heliocentric distance of the comet during the acquisition of its spectrum.
To reduce noise in the comet spectrum, we applied a binning of 60 pixels, which is equivalent to 1.2 nm intervals. We then used the same bin width as for the solar spectrum. To perform the division, we interpolated the binned solar irradiance onto the wavelength grid of the comet spectrum. Finally, we normalized the divided spectrum at 550 nm.
The comet 3I/ATLAS was also observed (with DDT) on July 3, 2025, from Calar Alto Observatory (Almería, Spain) using the 2.2 m telescope that is equipped with the Calar Alto Faint Object Spectrograph (CAFOS) instrument (pixel scale of 0.53″/pixel). On this night, several images were acquired with the B, V, and R filters, each with an exposure time of 60 s. Although nearby stars probably contaminated the signal of the comet in many of the images, some of them allowed us to extract the uncontaminated brightness. The flux was calibrated with the PanSTARRS DR2 catalog using the transformations from Tonry et al. (2012).
3. Results and discussion
Figure 1 shows the combined X-SHOOTER reflectance spectrum of 3I/ATLAS, normalized at 550 nm and corrected for the solar contribution. The spectral slopes (S′) in the UVB and VIS ranges are
-
UBV (320–560 nm): 38.3 ± 0.9 %/1000 Å
-
VIS (560–1020 nm): 12.5 ± 0.6 %/1000 Å.
From the broadband photometry we obtained at the Calar Alto observatory, it was possible to estimate colors. We derived B − V = 1.07 ± 0.10 and V − R = 0.51 ± 0.06, which are consistent with the slopes obtained from the spectrum and also with those reported by Opitom et al. (2025) at the 1σ level.
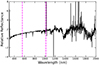 |
Fig. 1. Combined X-shooter reflectance spectrum of 3I/ATLAS, normalized at 550 nm. The spectrum was binned into 1.2 nm intervals and divided by the solar flux. The vertical pink bars mark the limits of the UBV-VIS and VIS-NIR arms. The regions centered at 1400 and 1900 nm are strongly affected by telluric absorption features. |
The signal in the NIR arm of X-SHOOTER is strongly affected by telluric absorption, which makes the data unreliable for computing S′ in this region.
We used the X-SHOOTER spectrum to compute S′ in the same visible spectral ranges as Opitom et al. (2025) from data acquired with VLT/MUSE. The results are shown below,
-
500–700 nm: 20.2 ± 1.6 %/1000 Å
-
700–900 nm: 15.9 ± 1.7 %/1000 Å
-
500–900 nm: 18.3 ± 0.6 %/1000 Å,
and they are consistent with those reported by the authors, 18 ± 3, 17 ± 4, and 18 ± 4%/1000 Å, respectively. In the spectral range from 528 to 860 nm, we measured a spectral slope for object 3I/ATLAS of S′ = 18.59 ± 0.80%/1000 Å. These values also agree well with the results reported by de la Fuente Marcos et al. (2025), who used OSIRIS at the Gran Telescopio Canarias (GTC) in La Palma, Seligman et al. (2025), who used the Supernova Integral Field Spectrogaph (SNIFS) at the University of Hawaii 2 m telescope in Maunakea, and Belyakov et al. (2025), who used the Next Generation Palomar Spectrograph (NGPS) at the Mount Palomar 200-inch telescope. This value indicates a significantly redder spectrum than for comet 2I/Borisov, which exhibited a slope of 4–10%/1000 Å over the same wavelength range (Deam et al. 2025). This corresponds to a spectral slope of 3I/ATLAS that is higher by at least a factor of ∼1.86 than that of 2I/Borisov, assuming its maximum reported value of 10%/1000 Å. A more pronounced reddening might indicate a different particle size distribution, possibly with a higher proportion of larger dust particles (which scatter red light more efficiently). Alternatively, it be caused by the exposition of the surface material to interstellar radiation and cosmic rays that altered the chemical surface composition for a long period during its interstellar travel, which would have led to more extensive space weathering that might result in redder colors (Brunetto et al. 2015; Zhang et al. 2022). These discrepancies highlight the complexity of characterizing these distant interstellar visitors and underscore the need for continued coordinated observations to fully understand their nature and origin.
Figure 2 shows a zoomed-in view of the spectrum. It highlights the OH and CN emission regions, specifically, within the 306–313 and 370–400 nm intervals. The OH and CN bands should appear in the shaded areas if they existed. It cannot be firmly concluded that any of the gases are detected in the coma of 3I/ATLAS; we therefore only derived upper limits to the production rates Q in mol s−1. To remove the solar signature, we used a solar spectrum with a high spectral resolution3 (Kurucz 2005) scaled to the flux of our spectrum by matching H and K Ca II lines in both spectra. The fluorescence scattering efficiency (so-called g-factor) is a function of heliocentric velocity. For the comet velocity of −57.54 km/s and rh = 4.4 AU at the time of our observations, the obtained g-factors are 6.25 × 10⁻¹⁵rh−2 and 3.34 × 10⁻¹³rh−2 erg/s/mol for OH (Δν = 0) and CN (Δν = 0), respectively (Schleicher 2010). As the gaseous emission is not detected, we computed the 3σ of the flux within the ranges 307 and 310.5 nm and 383.0 and 390.5 nm for OH and CN, respectively, to estimate the gas production of these species. In this way, we obtained between 307 and 310.5 nm and 383.0 and 390.5 nm, that is, 7.4 × 10⁻¹⁶ erg cm−2 s−1 and 4.6 × 10⁻¹⁷ erg cm−2 s−1, respectively. The upper limit to the total number of OH and CN molecules within the equivalent circular aperture radius, computed as in Roettger (1991), (1.5″) of the slit used in our observations (1.2″ width and 11″ length) is 7.4 × 1028 and 8.6 × 1025. The OH and CN production rate was then derived from a simple Haser model (Haser 1957) with lp = 2.4 × 10⁴ and ld = 1.6 × 10⁵ km for OH and lp = 1.3 × 10⁴ and ld = 2.2 × 10⁵ km for CN as the effective scale lengths at rh = 1 AU (A’Hearn et al. 1995). The velocity of the constant radial gas expansion of the coma is assumed to be v = 1 km/s. Therefore, we find QCN < 5.6 × 10²³ s−1 and QOH < 8.2 × 1026 s−1. Assuming that OH is produced by H2O photodissociation with a branching ratio of 0.9, we estimated that the water production rate is below 9.1 × 1026 s−1.
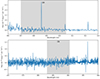 |
Fig. 2. Spectrum of 3I/ATLASafter the solar signature was removed, showing the wavelength ranges in which the gas emission bands should appear above the noise level. Top: OH region. The three apparent emission lines are hot pixels that remained from the data reduction and are not real emission lines within the OH band. Bottom: CN region and two adjacent continua. |
4. Conclusions
Comet 3I/ATLAS is the third known interstellar visitor to the Solar System. As soon as it was announced, it became the target of numerous observational campaigns using various telescopes, instruments, and observational techniques aimed at gaining a deeper understanding of this visitor, as mentioned above. We presented spectroscopic observations of the interstellar comet 3I/ATLAS obtained with the X-SHOOTER instrument at the ESO VLT that cover the 300–2500 nm spectral range. The reflectance spectrum, normalized at 550 nm and corrected for the solar contribution, exhibits a moderately red slope in the visible. This is consistent with previous measurements of 3I/ATLAS by Seligman et al. (2025) and Opitom et al. (2025), and it is broadly comparable to the spectral behavior of Solar System comets, trans-Neptunian objects, and D-type asteroids, which are the reddest class known (DeMeo & Carry 2013). Notably, Bolin et al. (2025) obtained colors that indicated a neutral spectral slope, which are at odds with our results. The possible color variations warrant further observations, especially multifilter or spectroscopic follow-up.
No clear gas emission bands (e.g., OH or CN) were detected in the near-UV range. From the absence of significant features in the observed spectrum, we derived upper limits to the production rates of CN and OH using a Haser model (Haser 1957). We obtained QCN < 5.6 × 10²³ mol s−1 and QOH < 8.2 × 1026 mol s−1.
These observations provide a valuable baseline for monitoring the evolution of 3I/ATLAS as it approaches perihelion. The lack of strong gas emission features in the UV (OH and CN) suggests that sublimation of water and hydrogen cyanide ices does not yet take place at this heliocentric distance. For comparison, the CN detection for 2I/Borisov was performed when the object was at a distance of 2.66 AU (Fitzsimmons et al. 2019) and OH was detected at 2.38 AU (McKay et al. 2020), in both cases closer to the Sun than the distance at which the X-SHOOTER observations were obtained.
Continued observations in the coming months are critical to assess the evolution of its coma and to constrain the nature and origin of this interstellar visitor better. Last, the attention gathered by 3I/ATLAS shows the interest of the community for these objects, reinforcing the need for coordinated efforts to observe and follow up on them, especially considering that the Rubin Observatory’s Legacy Survey for Space and Time may observe up to 70 such objects per year (Marčeta & Seligman 2023), one of them maybe becoming the target of ESA mission Comet Interceptor, which is planned to be launched by 2029.
Acknowledgments
We thank the ESO DG and DDT panel for awarding time to this project, and the service mode observer, telescope operator, and staff who enabled us to get the data. The same acknowledgment applies to the Calar Alto Observatory (CAHA) and its staff. A. Alvarez-Candal, J.L. Rizos, P. Santos-Sanz, J.L. Ortiz, P.J. Gutierrez, and L.M. Lara acknowledge financial support from the Severo Ochoa grant CEX2021-001131-S funded by MCIN/AEI/10.13039/501100011033. JLR, LML, PJG acknowledge financial support from grant PID2021-126365NB-C21. A. Alvarez-Candal acknowledges financial support from the project PID2023-153123NB-I00, funded by MCIN/AEI. P. Santos-Sanz acknowledges financial support by the Spanish grants PID2022-139555NB-I00 and PDC2022-133985-I00 funded by MCIN/AEI/10.13039/501100011033 and by the European Union “NextGenerationEU”/PRTR. The results presented in this document are based on data measured by the TSIS-1 Spectral Irradiance Monitor (SIM). These data are available from the TSIS-1 website at https://lasp.colorado.edu/tsis/data/. These data were accessed via the LASP Interactive Solar Irradiance Datacenter (LISIRD) (https://lasp.colorado.edu/lisird/). Based on observations collected at the European Southern Observatory under ESO programme 115.29F3.001. This research is also based on observations collected at the Centro Astronómico Hispano en Andalucía (CAHA), jointly operated by the Instituto de Astrofísica de Andalucía (IAA-CSIC) and Junta de Andalucía under programme DDT.25B.343.
References
- A’Hearn, M. F., Millis, R. C., Schleicher, D. O., Osip, D. J., & Birch, P. V. 1995, Icarus, 118, 223 [Google Scholar]
- Alarcon, M. R., Serra-Ricart, M., Licandro, J., et al. 2025, ATel, 17264, 1 [Google Scholar]
- Belyakov, M., Fremling, C., Graham, M. J., et al. 2025, arXiv e-prints [arXiv:2507.11720] [Google Scholar]
- Bolin, B. T., Belyakov, M., Fremling, C., et al. 2025, MNRAS, in press, https://doi.org/10.1093/mnrasl/slaf078 [Google Scholar]
- Brunetto, R., Loeffler, M. J., Nesvorný, D., Sasaki, S., & Strazzulla, G. 2015, in Asteroids IV, eds. P. Michel, F. E. DeMeo, & W. F. Bottke, 597 [Google Scholar]
- de la Fuente Marcos, R., Alarcon, M. R., Licandro, J., et al. 2025, A&A, 700, L9 [NASA ADS] [CrossRef] [EDP Sciences] [Google Scholar]
- Deam, S. E., Bannister, M. T., Opitom, C., et al. 2025, arXiv e-prints [arXiv:2507.05051] [Google Scholar]
- DeMeo, F. E., & Carry, B. 2013, Icarus, 226, 723 [NASA ADS] [CrossRef] [Google Scholar]
- Fitzsimmons, A., Hainaut, O., Meech, K. J., et al. 2019, ApJ, 885, L9 [Google Scholar]
- Guzik, P., Drahus, M., Rusek, K., et al. 2020, Nat. Astron., 4, 53 [Google Scholar]
- Haser, L. 1957, Bull. Soc. Roy. Sci. Liege, 43, 740 [NASA ADS] [Google Scholar]
- Hopkins, M. J., Dorsey, R. C., Forbes, J. C., et al. 2025, arXiv e-prints [arXiv:2507.05318] [Google Scholar]
- Jewitt, D. 2024, arXiv e-prints [arXiv:2407.06475] [Google Scholar]
- Jewitt, D., & Luu, J. 2019, ApJ, 886, L29 [Google Scholar]
- Jewitt, D., & Luu, J. 2025, ATel, 17263, 1 [Google Scholar]
- Jewitt, D., Luu, J., Rajagopal, J., et al. 2017, ApJ, 850, L36 [NASA ADS] [CrossRef] [Google Scholar]
- Kurucz, R. L. 2005, Mem. Soc. Astron. It. Suppl., 8, 189 [Google Scholar]
- Marčeta, D., & Seligman, D. Z. 2023, PSJ, 4, 230 [Google Scholar]
- McKay, A. J., Cochran, A. L., Dello Russo, N., & DiSanti, M. A. 2020, ApJ, 889, L10 [Google Scholar]
- Micheli, M., Farnocchia, D., Meech, K. J., et al. 2018, Nature, 559, 223 [Google Scholar]
- Opitom, C., Fitzsimmons, A., Jehin, E., et al. 2019, A&A, 631, L8 [NASA ADS] [CrossRef] [EDP Sciences] [Google Scholar]
- Opitom, C., Snodgrass, C., Jehin, E., et al. 2025, arXiv e-prints [arXiv:2507.05226] [Google Scholar]
- Roettger, E. E. 1991, Ph.D. Thesis, Johns Hopkins University, Maryland, USA [Google Scholar]
- Schleicher, D. G. 2010, AJ, 140, 973 [Google Scholar]
- Seligman, D. Z., & Moro-Martín, A. 2022, Contemp. Phys., 63, 200 [Google Scholar]
- Seligman, D. Z., Micheli, M., Farnocchia, D., et al. 2025, arXiv e-prints [arXiv:2507.02757] [Google Scholar]
- Tonry, J. L., Stubbs, C. W., Lykke, K. R., et al. 2012, ApJ, 750, 99 [Google Scholar]
- Vernet, J., Dekker, H., D’Odorico, S., et al. 2011, A&A, 536, A105 [NASA ADS] [CrossRef] [EDP Sciences] [Google Scholar]
- Ye, Q.-Z., Zhang, Q., Kelley, M. S. P., & Brown, P. G. 2017, ApJ, 851, L5 [NASA ADS] [CrossRef] [Google Scholar]
- Zhang, P., Tai, K., Li, Y., et al. 2022, A&A, 659, A78 [NASA ADS] [CrossRef] [EDP Sciences] [Google Scholar]
All Figures
|
Fig. 1. Combined X-shooter reflectance spectrum of 3I/ATLAS, normalized at 550 nm. The spectrum was binned into 1.2 nm intervals and divided by the solar flux. The vertical pink bars mark the limits of the UBV-VIS and VIS-NIR arms. The regions centered at 1400 and 1900 nm are strongly affected by telluric absorption features. |
| In the text | |
|
Fig. 2. Spectrum of 3I/ATLASafter the solar signature was removed, showing the wavelength ranges in which the gas emission bands should appear above the noise level. Top: OH region. The three apparent emission lines are hot pixels that remained from the data reduction and are not real emission lines within the OH band. Bottom: CN region and two adjacent continua. |
| In the text | |
Current usage metrics show cumulative count of Article Views (full-text article views including HTML views, PDF and ePub downloads, according to the available data) and Abstracts Views on Vision4Press platform.
Data correspond to usage on the plateform after 2015. The current usage metrics is available 48-96 hours after online publication and is updated daily on week days.
Initial download of the metrics may take a while.