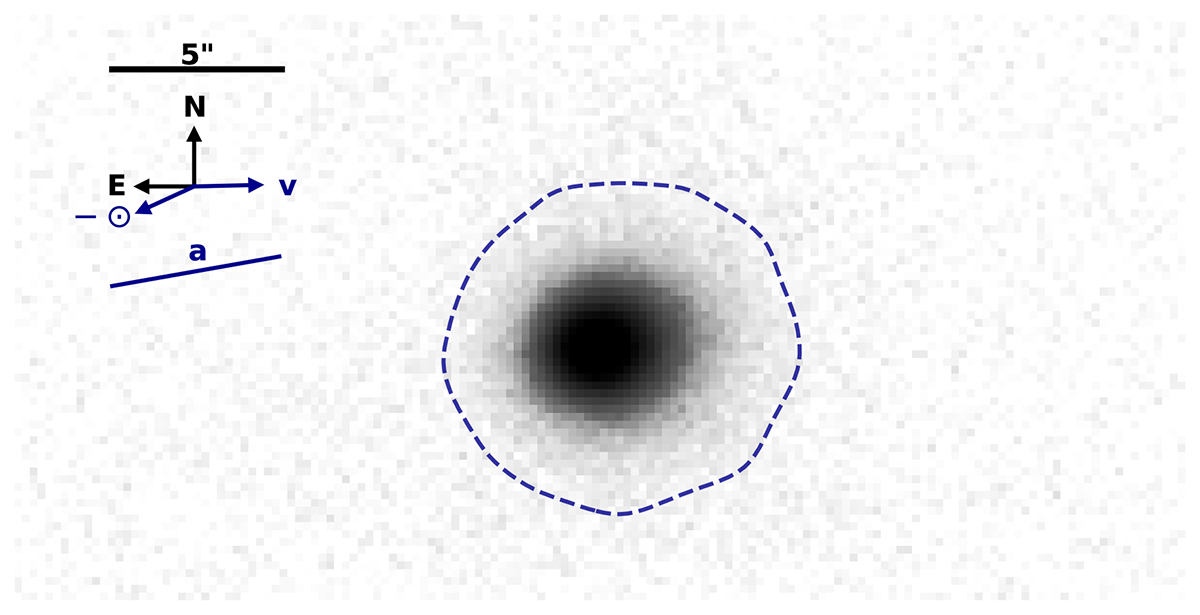
Fig. 1.
Download original image
Stacked g-band image created by co-adding 227 exposures (3.15 h) obtained on July 2, 2025. The overlaid contour delineates the coma boundary at the 2σ level above the sky background, corresponding to a surface brightness of μg = 25.4 mag arcsec−2 in the AB system. Arrows indicate the projected velocity vector of the comet (v) and the antisolar direction (−⊙). The direction of the semimajor axis (a) of the ellipse fit to the inner coma contours is also indicated.
Current usage metrics show cumulative count of Article Views (full-text article views including HTML views, PDF and ePub downloads, according to the available data) and Abstracts Views on Vision4Press platform.
Data correspond to usage on the plateform after 2015. The current usage metrics is available 48-96 hours after online publication and is updated daily on week days.
Initial download of the metrics may take a while.