| Issue |
A&A
Volume 700, August 2025
|
|
|---|---|---|
| Article Number | L9 | |
| Number of page(s) | 7 | |
| Section | Letters to the Editor | |
| DOI | https://doi.org/10.1051/0004-6361/202556439 | |
| Published online | 05 August 2025 | |
Letter to the Editor
Assessing interstellar comet 3I/ATLAS with the 10.4 m Gran Telescopio Canarias and the Two-meter Twin Telescope⋆
1
AEGORA Research Group, Facultad de Ciencias Matemáticas, Universidad Complutense de Madrid, Ciudad Universitaria, E-28040 Madrid, Spain
2
Instituto de Astrofísica de Canarias (IAC), C/Vía Láctea s/n, 38205 La Laguna, Tenerife, Spain
3
Departamento de Astrofísica, Universidad de La Laguna, Avda. Astrofísico Francisco Sánchez, 38206 La Laguna, Tenerife, Spain
4
Light Bridges, SL. Observatorio Astronómico del Teide. Carretera del Observatorio del Teide, s/n, Güímar, Santa Cruz de Tenerife, Spain
5
Universidad Complutense de Madrid, Ciudad Universitaria, E-28040 Madrid, Spain
6
GRANTECAN, Cuesta de San José s/n, 38712 Breña Baja, La Palma, Spain
⋆⋆ Corresponding author: This email address is being protected from spambots. You need JavaScript enabled to view it.
Received:
16
July
2025
Accepted:
24
July
2025
Abstract
Context. Theories of the formation and evolution of small bodies in planetary systems predict that they may escape into interstellar space at any time, leaked from extrasolar Oort clouds or ejected following close encounters with local planets or their host stars. After just two such interlopers – 1I/2017 U1 (‘Oumuamua) and 2I/Borisov – had been characterized, more questions had been raised than answered. Assessing the recently discovered interstellar comet 3I/ATLAS will only broaden our understanding of this complex topic.
Aims. Here, we investigate the spectral, cometary, and rotational properties of 3I/ATLAS as well as its dynamical context.
Methods. We identified the spectral type of 3I/ATLAS from the visible reflectance spectrum and used photometric observations to derive its level of activity and rotational properties. Observational data were obtained with the OSIRIS camera spectrograph at the 10.4 m Gran Telescopio Canarias and the Two-meter Twin Telescope. We used N-body simulations and statistical analyses of Gaia DR3 data to investigate the origin of 3I/ATLAS and its Galactic background.
Results. Interstellar comet 3I/ATLAS has a visible spectrum slightly redder than the ones of D-type asteroids, 1I/‘Oumuamua and 2I/Borisov, with a spectral slope of S′ = 18.3 ± 0.9 %/1000 Å in the 4000–9000 Å range, which is similar to the ones of trans-Neptunian objects and Centaurs. It has a conspicuous coma and its rotation period is 16.79 ± 0.23 h. The heliocentric components of its Galactic velocity are (U,V,W) = (−51.233 ± 0.006, −19.456 ± 0.004, +18.930−0.006+0.005) km s−1 with a radiant in Sagittarius of (α, δ) = (295.°043−0.°004+0.°003, −19.°0704−0.°0005+0.°0006). The analysis of a sample of kinematic analogs of 3I/ATLAS extracted from Gaia DR3 suggests that its parent system is part of the Galactic thin disk and includes a solar-like star with a slightly subsolar metallicity.
Conclusions. The results from the physical characterization of 3I/ATLAS further support the idea that extrasolar debris is not too different from the debris found in the Solar System and that it is the result of similar formation processes.
Key words: methods: numerical / techniques: photometric / celestial mechanics / comets: general / Oort Cloud / comets: individual: C/2025 N1 (ATLAS)
Based on observations made with the Gran Telescopio Canarias (GTC) telescope (program ID 62-GTC55/24B), in the Spanish Observatorio del Roque de los Muchachos of the Instituto de Astrofísica de Canarias (IAC), and the Two-meter Twin Telescope (TTT, PEI project PLANETIX25), in the Spanish Observatorio del Teide of the IAC.
© The Authors 2025
 Open Access article, published by EDP Sciences, under the terms of the Creative Commons Attribution License (https://creativecommons.org/licenses/by/4.0), which permits unrestricted use, distribution, and reproduction in any medium, provided the original work is properly cited.
This article is published in open access under the Subscribe to Open model. This email address is being protected from spambots. You need JavaScript enabled to view it. to support open access publication.
1. Introduction
Interstellar objects are like cosmic messages in a bottle that convey information about the planetary systems where they formed for anyone to analyze, connecting distant worlds meant to never interact. Any debris in the form of asteroids and comets that escapes a mature planetary system will move with values of its heliocentric Galactic velocity components similar to the ones of its parent star. In the absence of significant scattering due to close encounters with other stars, this kinematic signature will remain relatively unaltered for some time. At least two comets – C/1980 E1 (Bowell) and C/2024 L5 (ATLAS) – have been recently ejected from the Solar System after experiencing planetary encounters at close range (de la Fuente Marcos et al. 2024). In contrast, we had two visitors from beyond the Solar System – 1I/2017 U1 (‘Oumuamua) and 2I/Borisov – and they left more questions raised than answered (see, e.g., Williams 2017; Meech et al. 2017; Micheli et al. 2018; de León et al. 2019, 2020; Deam et al. 2025). The study of more of these visitors from beyond the Solar System will only broaden our understanding of this subject.
Object A11pl3Z was initially reported on July 1, 2025, by the Asteroid Terrestrial-impact Last Alert System (ATLAS, Tonry et al. 2018) observing from Rio Hurtado in Chile. It was announced as the third interstellar object on July 2 (Denneau et al. 2025) and designated 3I/ATLAS = C/2025 N1 (ATLAS). Follow-up and precovery observations (Ye et al. 2025a,b,c; Valdes et al. 2025; Z. T. F. Collaboration 2025; Bellini et al. 2025; Chernyshov et al. 2025) revealed a highly eccentric, hyperbolic orbit (eccentricity e > 6). Here, we investigate observationally the spectral properties of 3I/ATLAS in the visible region using low-resolution spectroscopy, its cometary activity using high-S/N (signal-to-noise ratio) images, and its rotational state from photometric observations. Our goal is to place 3I/ATLAS within the context of both known interstellar objects and Solar System comets. In addition, we use its orbital solution to numerically explore its dynamical evolution. This paper is organized as follows. In Sect. 2, we analyze the observed properties of 3I/ATLAS, comparing them with the ones of known interstellar objects and Solar System comets. Our results are discussed in Sect. 3 and our conclusions are summarized in Sect. 4. Observations, data reduction, spectral extraction, and other technical details and input data are included as appendices.
2. Results
Here, we use image enhancement algorithms applied to high-S/N images, reflectance spectroscopy, and photometric observations to investigate the physical properties and rotational state of 3I/ATLAS. The dynamical status of this comet was studied using N-body simulations and its Galactic context was explored by applying data-mining techniques. Observational details are included in Appendices A, B, C, and D. Appendix E provides information on the numerical integrations.
2.1. Cometary activity
We generated a deep, stacked image, shown in Fig. 1, by co-adding 227 exposures (a total of 3.15 h) from the TTT telescope obtained on the night of 2 July. An overlaid contour delineates the coma boundary at the 2σ level above the background sky. At this threshold, the surface brightness of the edge is μg = 25.4 mag arcsec−2 in the AB magnitude system. Details of the reduction and photometric calibration are given in Appendix B. The comet shows a well-defined coma, extending over a projected area of 10.5″ × 9.9″. The major axis of this ellipse-like region is oriented at a phase angle of 279.5° ±1.4°. At the time of observation, the geocentric distance was 3.44 au, so the physical dimensions were approximately 26 400 km × 24 700 km.
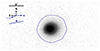 |
Fig. 1. Stacked g-band image created by co-adding 227 exposures (3.15 h) obtained on July 2, 2025. The overlaid contour delineates the coma boundary at the 2σ level above the sky background, corresponding to a surface brightness of μg = 25.4 mag arcsec−2 in the AB system. Arrows indicate the projected velocity vector of the comet (v) and the antisolar direction (−⊙). The direction of the semimajor axis (a) of the ellipse fit to the inner coma contours is also indicated. |
Using a circular aperture of radius 4″ (≈10 000 km) from the centroid, we measured the integrated flux and converted it into the dust-production proxy Afρ following the formulation of A’Hearn et al. (1984). After correcting this quantity for the α = 2.53° phase angle with the Halley–Marcus composite dust phase function (Schleicher & Bair 2011), we obtained a phase-normalized g-band value of A(0)fρ = 209 ± 4 cm. This is slightly larger than the 187.7 ± 4.1 cm reported by Bolin et al. (2025) for a comparable aperture.
2.2. Spectral properties
We studied the presence of typical cometary emission lines and bands in cometary comas (see e.g., Cochran et al. 2012). To do this, we proceeded as in de León et al. (2020), obtaining and analyzing the continuum-subtracted spectrum of 3I/ATLAS (see Fig. C.1). We first noticed that no cometary gas emission was detected, as was also reported by Alvarez-Candal et al. (2025) and Opitom et al. (2025); thus, the observed coma is mainly made of dust. Then we derived an upper limit for the most prominent gas emission band of comets in this spectral range, the CN (0–0) at 3880 Å, and obtained Q(CN)lim = 5.6 × 1024 mol s−1 using the method described in Appendix C. Our results are consistent with the Q(CN)lim value reported in Alvarez-Candal et al. (2025). Ours is larger because the σ of their spectrum in the CN band spectral range is better as a result of their much higher spectral resolution. Measured CN production rates at large heliocentric distances are unusual (A’Hearn et al. 1995) so 3I/ATLAS looks like a normal comet.
On the other hand, the normalized reflectance spectrum of interstellar comet 3I/ATLAS, shown in Fig. 2, is slightly redder than D-types, following DeMeo et al. (2009), and similar to the red spectra of the trans-Neptunian objects and Centaurs. For comparison purposes, we also show in the plot the normalized spectra of 1I/‘Oumuamua (Fitzsimmons et al. 2018) and 2I/Borisov (de León et al. 2020). We computed the reflectivity gradient, S′, by using a simple linear fit to the reflectance spectrum of 3I/ATLAS in the wavelength range 3800–9200 Å, obtaining a value of S′ = (18.3 ± 0.9)%/1000 Å. The spectral slope error corresponds to the standard deviation of the mean of a total of 100 iterations, randomly removing 10 points during each fit. We are not considering here the systematic error of the observations associated with the use of two different solar analogs (see Appendix A.1). Using the same wavelength intervals and normalization wavelength (6000 Å) as in Opitom et al. (2025), we obtain: (18.5 ± 0.5)%/1000 Å in the 5000–7000 Å range, (11.6 ± 0.4)%/1000 Å in the 7000–9000 Å range, and (14.6 ± 0.2)%/1000 Å in the 5000–9000 Årange.
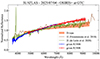 |
Fig. 2. Near-UV to visible reflectance spectrum of 3I/ATLAS obtained with OSIRIS at GTC and normalized to unity at 5500 Å. Normalized reflectance of 1I/‘Oumuamua (in brown) from Fitzsimmons et al. (2018) and 2I/Borisov (in green) from de León et al. (2020) are also shown for comparison, together with the D-type spectral taxon from DeMeo et al. (2009). |
2.3. Rotational state
Time-series photometry is presented in Fig. 3, which includes observations from three nights (Table A.1). Data with excessively high noise due to poor seeing were removed from the plot, but were taken into account during the normalization of each light curve by subtracting the nightly median magnitude, which allowed them to be combined. The light curve shows a low amplitude of 0.2 magnitudes, which is typical for an object with cometary activity where the variability in light reflection from the nucleus’s rotation is attenuated by the presence of a surrounding homogeneous coma (Licandro et al. 2000). This is also consistent with observations in other preliminary works on 3I/ATLAS, such as Seligman et al. (2025), in which, although they did not find a periodicity, they indicate that the brightness variations are small. A clear trend is observed in the TTT data from each night of observation. We estimate the rotation period of 3I/ATLAS to be Prot = 16.79 ± 0.23 h. Further details are provided in Appendix D.
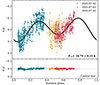 |
Fig. 3. Folded light curve of 3I/ATLAS. The top panel shows the magnitude variation relative to the nightly median, which is, in the g band, 18.76, 18.79, and 18.49, respectively. The black line corresponds to a second-order sinusoidal curve fit with a period obtained from the PDM method. The bottom panel displays the data for a non-variable control star, also normalized by its median magnitude, demonstrating the lack of significant variation in the photometric calibration. |
2.4. Dynamics
The kinematic properties of interstellar interlopers are expected to preserve, for the most part, the kinematic signatures of their host stars. Analyzing the pre-encounter trajectory of 3I/ATLAS might shed some light on its true origin. We performed integrations backward in time of 1000 control orbits of 3I/ATLAS generated by the Monte Carlo using the covariance matrix (MCCM) method described by de la Fuente Marcos & de la Fuente Marcos (2015) and modified here to work with hyperbolic orbits. A statistical analysis (median and 16th and 84th percentiles) of the results indicates that at 1.7819 ± 0.0003 pc from the Sun and 3 × 10⁴ yr into the past, 3I/ATLAS was moving inward, at −57.980 km s−1 – 1I/2017 U1 (‘Oumuamua) had −26 km s−1, in comparison (Mamajek 2017), and C/2019 Q4 (Borisov) had
  km s−1 (de León et al. 2020) – and projected toward (radiant or antapex) α = 19h 40m 10.2s, δ = −19° 04′ 13.4″ (295
 043
043 ,
,  ) in the constellation of Sagittarius with Galactic coordinates
  ,
,  , and ecliptic coordinates
  ,
,  . The heliocentric components of its Galactic velocity were
  km s−1. These values were computed in the manner described by de la Fuente Marcos & de la Fuente Marcos (2019). The components of the solar-motion-corrected heliocentric Cartesian velocities of 3I/ATLAS are (62.3 ± 0.8, −7.2 ± 0.5, 26.2 ± 0.4) km s−1. We searched the Gaia third data release (DR3, Gaia Collaboration 2016, 2023), looking for kinematic analogs of 3I/ATLAS toward the region of the radiant. Figure F.1 shows 3I/ATLAS in its Galactic kinematic context.
3. Discussion
Our spectroscopic results are comparable with the ones reported by Opitom et al. (2025) and Alvarez-Candal et al. (2025), although we obtained a slightly bluer spectral slope in the 7000–9000 Å range. Interestingly, Belyakov et al. (2025) also found a more neutral slope for their spectrum in the range 7000–10 000 Å, as they did in Kareta et al. (2025) at longer wavelengths. Seligman et al. (2025) report a slope of S′∼18%/1000 Å from their g′, r′, i′, z′ colors and (17.1 ± 0.2)%/1000 Å from their spectrum, consistent with the spectral gradient provided in this work in the 3800–9200 Å range. The spectral slope of 3I/ATLAS is redder than the nominal values adopted by Jewitt & Seligman (2023) for 1I/‘Oumuamua (15 ± 5 %/1000 Å) and 2I/Borisov (12 ± 1 %/1000 Å).
Considering Nissen (2004), Fig. 1.3, the components of the solar-motion-corrected heliocentric Cartesian velocities of 3I/ATLAS place it in the thin disk as the value of  is 67.58 km s−1 and VLSR = −7.2 km s−1. The Toomre diagram indicates that the thin disk is inside
  km s−1, with the thick disk in the interval (85, 180) km s−1 and the halo outside 180 km s−1 (see Fig. 3 in Bensby et al. 2003). In addition to this kinematic constraint, the analysis of a sample of kinematic analogs of 3I/ATLAS from Gaia DR3 gives a value of [Fe/H] = –0.04 ± 0.14 (see Appendix F), which is somewhat subsolar, but far from –1.2 < [Fe/H] < –0.4 in the thick disk (see, e.g. Nissen 2004). An origin in the thick disk is favored by Hopkins et al. (2025). Taylor & Seligman (2025) argue for an age range of 3–11 Gyr and a value of [Fe/H]
  , both of which are compatible with thin disk membership.
4. Conclusions
In this paper, we have presented observations of interstellar comet 3I/ATLAS obtained with GTC and TTT. The GTC observations were used to derive the spectral class and visible slope of 3I/ATLAS; the TTT ones provided the rotational period and insights into its cometary activity. Direct N-body simulations and statistical analyses were carried out to investigate the context of its orbital evolution. Our conclusions can be summarized as follows.
-
High-S/N images clearly show that 3I/ATLAS is active at 3.44 au, with a well–defined dust coma that extends over a projected area of 10.5″ × 9.9″ (26 400 km × 24 700 km at the comet’s geocentric distance).
-
3I/ATLAS has a visible reflectance spectrum slightly redder than the spectra of 1I/‘Oumuamua and 2I/Borisov, but consistent with that of Solar System comets, trans-Neptunian objects, and Centaurs. Its overall spectral gradient in the 3800–9200 Å range, S′ = (18.3 ± 0.9)%/1000 Å, is in good agreement with the findings of other authors, although somewhat bluer in the 7000–5000 Å range (S′ = 11.6 ± 0.4)%/1000 Å), suggesting a more neutral slope at longer wavelengths.
-
No signature of gas emission is observed in the visible spectrum of 3I/ATLAS, which is normal in Solar System comets observed at r > 4 au. We obtained an upper limit for the CN production rate of Q(CN)lim = 5.6 × 1024 mol s−1.
-
The 3I/ATLAS light curve in the g′ band exhibits a low-amplitude variation with a period of 16.79 ± 0.23 h.
-
The analysis of an extensive set of N-body simulations indicates that 3I/ATLAS came from interstellar space and will return to it after reaching its perihelion on October 29, 2025. Its kinematic signature is consistent with an origin in the Galactic thin disk.
Follow-up observations of this object will provide further information on the properties of its parent planetary system.
Acknowledgments
We thank the anonymous referee for a prompt, constructive, detailed, and actionable report. We also thank Luisa Lara for her useful comments on the manuscript. RdlFM acknowledges funding from the “ENIMUS” Advanced Grant from the European Research Council (ERC) under the European Union’s Horizon 2020 research and innovation programme (grant agreement ID 101097905). This work was partially supported by the Spanish ‘Agencia Estatal de Investigación (Ministerio de Ciencia e Innovación)’ under grant PID2020-116726RB-I00 /AEI/10.13039/501100011033. This article is based on observations made in the Two-meter Twin Telescope (TTT, http://ttt.iac.es) sited at the Teide Observatory of the Instituto de Astrofísica de Canarias (IAC), that Light Bridges operates in Tenerife, Canary Islands (Spain). The observation time rights (DTO) used for this research were consumed in the PEI ‘PLANETIX25’. This research used storage and computing capacity in ASTRO POC’s EDGE computing center at Tenerife under the form of Indefeasible Computer Rights (ICR). The ICR were consumed in the PEI “PLANETIX25” with the collaboration of Hewlett Packard Enterprise and VAST DATA. This work has made use of data from the European Space Agency (ESA) mission Gaia (https://www.cosmos.esa.int/gaia), processed by the Gaia Data Processing and Analysis Consortium (DPAC, https://www.cosmos.esa.int/web/gaia/dpac/consortium). Funding for the DPAC has been provided by national institutions, in particular the institutions participating in the Gaia Multilateral Agreement.
References
- A’Hearn, M. F., Schleicher, D. G., Millis, R. L., Feldman, P. D., & Thompson, D. T. 1984, AJ, 89, 579 [Google Scholar]
- A’Hearn, M. F., Millis, R. C., Schleicher, D. O., Osip, D. J., & Birch, P. V. 1995, Icarus, 118, 223 [Google Scholar]
- Akhlaghi, M., & Ichikawa, T. 2015, ApJS, 220, 1 [Google Scholar]
- Alvarez-Candal, A., Rizos, J. L., Lara, L. M., et al. 2025, A&A, 700, L10 [NASA ADS] [CrossRef] [EDP Sciences] [Google Scholar]
- Bellini, F., Aletti, A., Buzzi, L., et al. 2025, Minor Planet Electronic Circulars, 2025-N89 [Google Scholar]
- Belyakov, M., Fremling, C., Graham, M. J., et al. 2025, Res. Notes AAS, 9, 194 [Google Scholar]
- Bensby, T., Feltzing, S., & Lundström, I. 2003, A&A, 410, 527 [CrossRef] [EDP Sciences] [Google Scholar]
- Bertin, E. 2006, in Astronomical Data Analysis Software and Systems XV, eds. C. Gabriel, C. Arviset, D. Ponz, & S. Enrique, Astronomical Society of the Pacific Conference Series, 351, 112 [Google Scholar]
- Bertin, E., Mellier, Y., Radovich, M., et al. 2002, in Astronomical Data Analysis Software and Systems XI, eds. D. A. Bohlender, D. Durand, & T. H. Handley, Astronomical Society of the Pacific Conference Series, 281, 228 [NASA ADS] [Google Scholar]
- Bohlin, R. C., Gordon, K. D., & Tremblay, P. E. 2014, PASP, 126, 711 [NASA ADS] [Google Scholar]
- Bolin, B. T., Belyakov, M., Fremling, C., et al. 2025, MNRAS, in press, https://doi.org/10.1093/mnrasl/slaf078 [Google Scholar]
- Cepa, J. 2010, in Highlights of Spanish Astrophysics V, eds. J. M. Diego, L. J. Goicoechea, J. I. González-Serrano, & J. Gorgas, Astrophysics and Space Science Proceedings, 14, 15 [Google Scholar]
- Cepa, J., Aguiar, M., Escalera, V. G., et al. 2000, in Optical and IR Telescope Instrumentation and Detectors, eds. M. Iye, & A. F. Moorwood, Society of Photo-Optical Instrumentation Engineers (SPIE) Conference Series, 4008, 623 [NASA ADS] [CrossRef] [Google Scholar]
- Chambers, K. C., Magnier, E. A., Metcalfe, N., et al. 2016, arXiv e-prints [arXiv:1612.05560] [Google Scholar]
- Chernyshov, A., Nazarov, S., Robinson, J., et al. 2025, Minor Planet Electronic Circulars, 2025-N102 [Google Scholar]
- Cochran, A. L., Barker, E. S., & Gray, C. L. 2012, Icarus, 218, 144 [Google Scholar]
- de la Fuente Marcos, C., & de la Fuente Marcos, R. 2015, MNRAS, 453, 1288 [Google Scholar]
- de la Fuente Marcos, R., & de la Fuente Marcos, C. 2019, A&A, 627, A104 [NASA ADS] [CrossRef] [EDP Sciences] [Google Scholar]
- de la Fuente Marcos, R., de la Fuente Marcos, C., & Aarseth, S. J. 2024, A&A, 690, A395 [NASA ADS] [CrossRef] [EDP Sciences] [Google Scholar]
- de León, J., Licandro, J., Serra-Ricart, M., et al. 2019, Res. Notes Am. Astron. Soc., 3, 131 [Google Scholar]
- de León, J., Licandro, J., de la Fuente Marcos, C., et al. 2020, MNRAS, 495, 2053 [Google Scholar]
- Deam, S. E., Bannister, M. T., Opitom, C., et al. 2025, PSJ, submitted [arXiv:2507.05051] [Google Scholar]
- DeMeo, F. E., Binzel, R. P., Slivan, S. M., & Bus, S. J. 2009, Icarus, 202, 160 [Google Scholar]
- Denneau, L., Siverd, R., Tonry, J., et al. 2025, Minor Planet Electronic Circulars, 2025-N12 [Google Scholar]
- Fitzsimmons, A., Snodgrass, C., Rozitis, B., et al. 2018, Nat. Astron., 2, 133 [Google Scholar]
- Gaia Collaboration (Prusti, T., et al.) 2016, A&A, 595, A1 [NASA ADS] [CrossRef] [EDP Sciences] [Google Scholar]
- Gaia Collaboration (Vallenari, A., et al.) 2023, A&A, 674, A1 [NASA ADS] [CrossRef] [EDP Sciences] [Google Scholar]
- Giorgini, J. 2011, in Journées Systèmes de Référence Spatio-temporels 2010, ed. N. Capitaine, 87 [Google Scholar]
- Giorgini, J. D. 2015, in IAU General Assembly, 29, 2256293 [Google Scholar]
- Hopkins, M. J., Dorsey, R. C., Forbes, J. C., et al. 2025, ApJL, submitted [arXiv:2507.05318] [Google Scholar]
- Jewitt, D., & Seligman, D. Z. 2023, ARA&A, 61, 197 [NASA ADS] [CrossRef] [Google Scholar]
- Kareta, T., Champagne, C., McClure, L., et al. 2025, ApJL, submitted [arXiv:2507.12234] [Google Scholar]
- Landolt, A. U. 1992, AJ, 104, 340 [Google Scholar]
- Lang, D., Hogg, D. W., Mierle, K., Blanton, M., & Roweis, S. 2010, AJ, 139, 1782 [Google Scholar]
- Licandro, J., Serra-Ricart, M., Oscoz, A., Casas, R., & Osip, D. 2000, AJ, 119, 3133 [Google Scholar]
- Mamajek, E. 2017, Res. Notes Am. Astron. Soc., 1, 21 [Google Scholar]
- Meech, K. J., Weryk, R., Micheli, M., et al. 2017, Nature, 552, 378 [Google Scholar]
- Micheli, M., Farnocchia, D., Meech, K. J., et al. 2018, Nature, 559, 223 [Google Scholar]
- Nissen, P. E. 2004, in Origin and Evolution of the Elements, eds. A. McWilliam& M. Rauch, 154 [Google Scholar]
- Opitom, C., Snodgrass, C., Jehin, E., et al. 2025, MNRAS, submitted [arXiv:2507.05226] [Google Scholar]
- Popescu, M. M., Tatsumi, E., Licandro, J., et al. 2025, PSJ, 6, 42 [Google Scholar]
- Press, W. H., & Rybicki, G. B. 1989, ApJ, 338, 277 [Google Scholar]
- Schleicher, D. G. 2010, AJ, 140, 973 [Google Scholar]
- Schleicher, D. G., & Bair, A. N. 2011, AJ, 141, 177 [Google Scholar]
- Seligman, D. Z., Micheli, M., Farnocchia, D., et al. 2025, ApJL, accepted [arXiv:2507.02757] [Google Scholar]
- Taylor, A. G., & Seligman, D. Z. 2025, ApJL, submitted [arXiv:2507.08111] [Google Scholar]
- Tonry, J. L., Denneau, L., Heinze, A. N., et al. 2018, PASP, 130, 064505 [Google Scholar]
- Valdes, F., Valvasori, A., Gerhard, C., et al. 2025, Minor Planet Electronic Circulars, 2025-N44 [Google Scholar]
- Williams, G. V. 2017, Minor Planet Electronic Circulars, 2017-V17 [Google Scholar]
- Ye, Q. Z., Z. T. F. Collaboration, Lee, H. J., et al. 2025a, Minor Planet Electronic Circulars, 2025-N22 [Google Scholar]
- Ye, Q. Z., Z. T. F. Collaboration, Abdelaziz, A. M., et al. 2025b, Minor Planet Electronic Circulars, 2025-N35 [Google Scholar]
- Ye, Q. Z., Z. T. F. Collaboration, Serrau, M., et al. 2025c, Minor Planet Electronic Circulars, 2025-O05 [Google Scholar]
- Z. T. F. Collaboration (Ye, Q. Z., et al.) 2025, Minor Planet Electronic Circulars, 2025-N51 [Google Scholar]
Appendix A: Observations and Data Reduction
Observations of interstellar comet 3I/ATLAS were carried out soon after its discovery and confirmation of interstellar nature, using the telescope facilities located at the Canarian Observatories (OCAN), managed by the Instituto de Astrofísica de Canarias (Spain). Observational circumstances are described in the following sections and summarized in Table A.1.
Observational circumstances of the spectra and light-curves presented of 3I/ATLAS in this paper.
A.1. Spectroscopy
Spectroscopic observations of 3I/ATLAS in the near-UV and visible wavelengths (3500–9200 Å) were obtained using OSIRIS+ camera-spectrograph (Cepa et al. 2000; Cepa 2010) at the 10.4m Gran Telescopio Canarias (GTC), located at the El Roque de Los Muchachos Observatory (La Palma, Spain). The OSIRIS+ instrument was upgraded in January 2023 to have enhanced sensitivity in the blue, down to 3700-3800 Å. It is equipped with 2k×4k pixel detector that provides a 7.8×7.8 arcmin2. We used the R300B (3600–7500 Å, dispersion of 4.96 Å pixel−1 for a 0.6" slit) and R300R (4800–9200 Å, dispersion of 7.74 Å pixel−1 for a 0.6" slit) grisms and a 1.5" slit width oriented in the parallactic angle. The telescope tracking was at the comet’s proper motion. Two spectrophotometric standard stars (Feige 110 and Ross 640) were observed to flux calibrate the spectra. In the same way, to obtain the relative reflectance spectrum of the comet, we also observed two solar analog stars — SA110-361 and SA112-1333 — from the Landolt catalog (Landolt 1992).
Data reduction included bias and flat-field correction, sky background subtraction, and one-dimensional aperture extraction, corresponding to the pixel where the peak intensity of the cometary profile decayed to its 10% value. Wavelength calibration was then applied to the one-dimensional spectra using Xe+Ne+HgAr lamps. This procedure was applied to the spectra of the comet and the stars (both spectrophotometric and solar analogs). We divided the individual spectra of the comet by the spectra of the solar analogs, and the resulting ratio were averaged to get the final reflectance spectra. To create the final composite reflectance spectrum shown in Fig. 2, we put together the R300B and R300R data using the common wavelength interval (6000–7000 Å), and normalized the result to unity at 5500 Å. The light shaded areas in the figure correspond to the standard deviation of the average, which introduces an error in the calculation of the spectral gradient S’ smaller than 1%/1000 Å.
A.2. Imaging
Photometric follow-up was carried out on the nights of July 2, 3 and 5, 2025, using one of the two telescopes of the Two-meter Twin Telescope (TTT), located at the Teide Observatory, Canary Islands (Lat. 28°17′56″ N, Long. 16°30′35″W, Alt. 2361.9 m). This is a 2-m f/6 Ritchey-Chrétien telescope that is currently in its commissioning phase. An Andor iKon-L 936 2k×2k camera is mounted at the Nasmyth 2 focus, equipped with a back-illuminated 13.5 μm pixel−1 BEX2-DD CCD sensor, resulting in a field of view of 7.85′×7.85′ and a plate scale of 0.23″ pixel−1. The object transited the Galactic plane (b∼1 6, l∼11°, on July 2), a region with both very high stellar density and significant differential extinction. Given that this extinction strongly affects bluer bands, we decided to observe with a g′ filter to reduce source blending. On the nights of July 3 and 5, a dithering pattern was used to avoid the potential effects of gradients across the sensor caused by the presence of the Moon and high airmass on the photometric quality of the data. A brief description of the image processing methods is included in Appendices B and D.
Appendix B: Deep imaging data reduction
Each raw frame was first corrected for a master bias (median–stack of 21 bias frames), saturated pixels were masked, and the flat-field correction was performed using twilight flats. A comprehensive sky mask using aggresive Gnuastro’s NoiseChisel (Akhlaghi & Ichikawa 2015) segmentation was applied, and the sky level was measured via a sigma–clipped median of the unmasked pixels and subtracted, ensuring removal of background without oversubtracting the faint coma.
An initial WCS solution was obtained using Astrometry.net (Lang et al. 2010) against Gaia DR3, refined through three SCAMP (Bertin 2006) iterations. Each image was then cropped to a 3’×3’ region centered on the comet, using coordinates provided by JPL Horizons. To avoid potential astrometric uncertainties, the center was re-calculated from the object’s brightness centroid. Cutout images were reastrometrized and resampled onto a common grid with SWarp (Lanczos3 method, Bertin et al. 2002). Photometric calibration was performed with reference to the Pan-STARRS DR1 survey (Chambers et al. 2016). We cross-matched the TTT field with Gaia DR3 (Gaia Collaboration 2023) to isolate bona fide stars, selected point sources by their FWHM, and performed aperture photometry with radii that enclose the PSF wings on both image sets, only retaining unsaturated stars with high signal-to-noise. Fluxes from both data sets were referenced to Gaia BP/RP spectra to remove the small zero–point offset between surveys, and a colour correction based on the g − r index and the respective filter–transmission curves accounted for filter–response mismatches. The final scale factor places the TTT images on the AB system with a global zero–point of 22.5 mag. this factor was applied to every sky–subtracted frame before stacking, thereby converting pixel values from ADU to physical flux units.
After calibration, we examined all 326 frames for residual contamination (e.g., faint field stars or tracking artifacts) and excluded 99 images with any potential contamination to the comet signal. The remaining 227 frames, totaling 3.15 hours of integration, were combined using an inverse variance–weighted mean, where each image’s weight was set by the reciprocal of its background variance. In this combination, Noisechisel was used for masking every source but the comet and a 3σ clipping was applied to reject outliers.
Appendix C: Gas production rate computation
To study the presence of typical cometary emission lines/bands of CN, C2, C3 or NH2 usually detected in the visible range in active comets (see, e.g., Cochran et al. 2012), we first obtained the continuum-subtracted spectrum of 3I/ATLAS (see Fig.C.1) using a spectrum of the Sun downloaded from the CALSPEC compilation (Bohlin et al. 2014) as we did in de León et al. (2020). Notice that the noisier part of the spectrum falls below 3800 Å and thus it does not affect our computations. We first noticed that there is no evidence of any gas emission in our spectrum. As the CN (0–0) emission band at 3880 Å use to be the most conspicuous one in comets, we computed the upper limit of the detectable CN flux within the S/N of our spectrum in the 3830–3905 Å range (see Fig.C.1 inset plot) and derived the upper limit of the CN production rate (Q(CN)lim) as follows: i) we first computed the σ of the flux in the continuum-subtracted spectrum in the 3830–3905 Å spectral range and obtained a value of 2.01 × 10⁻¹⁸ erg s−1 cm−2 Å−1; ii) assuming a detection limit of 3-σ as Flim = 3 ⋅ σ ⋅ Δλ = 4.53 × 10⁻¹⁶ erg s−1 cm−2; iii) we finally converted Flim into column density using the g factor from Schleicher (2010), scaled to both the heliocentric distance and the velocity of the comet. To compute the gas production rate, we assumed the Haser modeling with the outflow velocity vp scaled with rh (vp = 0.86rh−4 km s−1), customary values for the daughter velocity vd = 1 km s−1, and scale lengths given in A’Hearn et al. (1995). We obtained Q(CN)lim = 5.6 × 1024 mol s−1.
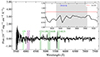 |
Fig. C.1. The flux spectrum of 3I/ATLAS obtained with OSIRIS at GTC, subtracted from the solar continuum. The most relevant regions were CN, C3 and c2 bands in cometary spectra are shown. In the inset image, a zoom of the CN most prominent cometary emission feature is shown. No significant signal is present in the data. |
Appendix D: Period-finding method
All raw TTT frames were first corrected for bias and twilight flat–field variations using standard procedures. Point–source photometry was then performed with a GPU–accelerated custom pipeline that employs PSF–matched convolutions for source detection and adaptive, S/N–driven aperture photometry with PSF–based aperture corrections. For each exposure, we matched field stars to the Pan-STARRS DR1 catalog (Chambers et al. 2016) to derive a photometric zero-point, which was used to calibrate the comet and control-star magnitudes in the resulting time series. This pipeline has been validated in previous works (Popescu et al. 2025) and will be released as open-source software (Alarcon et al., in prep.).
To determine the rotation period of 3I/ATLAS from the TTT time–series photometry, we began by computing a generalized Lomb–Scargle periodogram (Press & Rybicki 1989). This method is well suited for unevenly sampled data and quantifies the significance of sinusoidal signals by fitting 2nd-order sine curves at trial frequencies while properly normalizing for observational errors. Applying it to the combined g′–band light curve revealed a peak at Prot = 16.66 h. To corroborate this result without assuming purely sinusoidal variability, we employed the phase dispersion minimization (PDM) technique, which searches for the period that minimizes the variance of data points within phase bins. Our PDM statistic exhibited a global minimum at a similar period identified by the Lomb–Scargle analysis. We then fit a Gaussian function to the PDM curve in the vicinity of this minimum (see Fig. D.1), yielding a refined rotation period of Prot = 16.79 ± 0.23 h. The quoted uncertainty corresponds to the standard deviation of the Gaussian fit and encompasses both measurement noise and sampling effects. We adopt this value as our best estimate in the main text.
To verify that the observed periodic modulation originates from the comet’s nucleus and coma rather than observational artifacts, we investigated potential correlations between measured flux and atmospheric seeing, as well as any drifts in our photometric zero point. In addition, we extracted light curves for several field stars of similar brightness; the bottom panel of Fig. 3 presents a representative non–variable control star, which shows scatter an order of magnitude smaller than the amplitude of the comet’s modulation. These checks confirm that our period determination is robust against changes in seeing and calibration, and that the periodic signal reflects the intrinsic rotation of 3I/ATLAS.
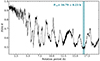 |
Fig. D.1. Phase Dispersion Minimization (PDM) Analysis. The PDM theta statistic is plotted against the trial period, with the global minimum identifying the best-fit period of 16.79 ± 0.23 hours, The 1-sigma (FWHM/2.355) uncertainty region, marked by the blue shaded band, was derived from a gaussian fit to the minimum. |
Appendix E: Orbit data and post-perihelion evolution
The orbital solution in Table E.1 is currently based on 762 observations with an observational time span of 60 days, it is referred to epoch JD 2460868.5 TDB, which is the origin of time in the calculations. It was retrieved from Jet Propulsion Laboratory’s (JPL) Small-Body Database (SBDB)1 provided by the Solar System Dynamics Group (SSDG, Giorgini 2011, 2015).2 Its current path is hyperbolic with a statistical significance (barycentric) above 1718σ. No known processes, close encounters with known planets included, can explain such a large eccentricity if we were to assume that 3I/ATLAS has an origin in the Solar System; an extrasolar origin emerges as the single other alternative.
Heliocentric and barycentric orbital elements and 1σ uncertainties of comet C/2025N1 (ATLAS).
Answering the question of where 3I/ATLAS is headed next after its flyby with the Sun requires the analysis of a similar set of direct N-body simulations (also with MCCM), but forward in time. At 1.7823±0.0003 pc from the Sun and 3×10⁴ yr into the future, this object will be receding from us at  km s−1 toward (apex) α = 06h 20m 55.3s, δ = +19° 48′ 14.0″ (95
 23±0
23±0 06, 19
 8039±0.0005) in the constellation of Gemini with Galactic coordinates
  ,
,  , and ecliptic coordinates
  ,
,  . The heliocentric components of its Galactic velocity will be
  km s−1.
Appendix F: Gaia DR3 sample
An origin in the Galactic thin disk is supported by the fact that several stars in Gaia third data release (DR3) with properties consistent with thin disk membership have kinematic signatures compatible with that of 3I/ATLAS. Gaia DR3 provides estimates of Teff and [Fe/H] for some of the relevant stars and the values are consistent with those of Solar-like stars of Solar-like metallicity as shown in Fig. F.2. One star (source 4091535895147524608) with 3I/ATLAS-like kinematics has α = 18:34:31.4, δ=−21:39:30, Teff = 4580.2 K, [Fe/H] = 0.20, a heliocentric distance of 2232.16 pc, and heliocentric Galactic velocity (U, V, W) = (−51 ± 4, −20.1 ± 1.3, +18 ± 2) km s−1. Unfortunately, the uncertainties in the values of the radial velocity of the relevant stars in Gaia DR3 are significant and this leads to errors in the components of the velocity which are much larger than those computed for 3I/ATLAS.
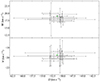 |
Fig. F.1. Galactic kinematic context of 3I/ATLAS. Gaia DR3 stars with values of their heliocentric Galactic velocity components close to those of 3I/ATLAS in black, 3I/ATLAS in green. |
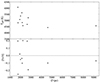 |
Fig. F.2. Kinematical analogs of 3I/ATLAS: Relevant properties. Top panels:Gaia DR3 estimated values of effective temperature and heliocentric distance. Bottom panel:Gaia DR3 estimated values of metallicity and heliocentric distance. |
All Tables
Observational circumstances of the spectra and light-curves presented of 3I/ATLAS in this paper.
Heliocentric and barycentric orbital elements and 1σ uncertainties of comet C/2025N1 (ATLAS).
All Figures
|
Fig. 1. Stacked g-band image created by co-adding 227 exposures (3.15 h) obtained on July 2, 2025. The overlaid contour delineates the coma boundary at the 2σ level above the sky background, corresponding to a surface brightness of μg = 25.4 mag arcsec−2 in the AB system. Arrows indicate the projected velocity vector of the comet (v) and the antisolar direction (−⊙). The direction of the semimajor axis (a) of the ellipse fit to the inner coma contours is also indicated. |
| In the text | |
|
Fig. 2. Near-UV to visible reflectance spectrum of 3I/ATLAS obtained with OSIRIS at GTC and normalized to unity at 5500 Å. Normalized reflectance of 1I/‘Oumuamua (in brown) from Fitzsimmons et al. (2018) and 2I/Borisov (in green) from de León et al. (2020) are also shown for comparison, together with the D-type spectral taxon from DeMeo et al. (2009). |
| In the text | |
|
Fig. 3. Folded light curve of 3I/ATLAS. The top panel shows the magnitude variation relative to the nightly median, which is, in the g band, 18.76, 18.79, and 18.49, respectively. The black line corresponds to a second-order sinusoidal curve fit with a period obtained from the PDM method. The bottom panel displays the data for a non-variable control star, also normalized by its median magnitude, demonstrating the lack of significant variation in the photometric calibration. |
| In the text | |
|
Fig. C.1. The flux spectrum of 3I/ATLAS obtained with OSIRIS at GTC, subtracted from the solar continuum. The most relevant regions were CN, C3 and c2 bands in cometary spectra are shown. In the inset image, a zoom of the CN most prominent cometary emission feature is shown. No significant signal is present in the data. |
| In the text | |
|
Fig. D.1. Phase Dispersion Minimization (PDM) Analysis. The PDM theta statistic is plotted against the trial period, with the global minimum identifying the best-fit period of 16.79 ± 0.23 hours, The 1-sigma (FWHM/2.355) uncertainty region, marked by the blue shaded band, was derived from a gaussian fit to the minimum. |
| In the text | |
|
Fig. F.1. Galactic kinematic context of 3I/ATLAS. Gaia DR3 stars with values of their heliocentric Galactic velocity components close to those of 3I/ATLAS in black, 3I/ATLAS in green. |
| In the text | |
|
Fig. F.2. Kinematical analogs of 3I/ATLAS: Relevant properties. Top panels:Gaia DR3 estimated values of effective temperature and heliocentric distance. Bottom panel:Gaia DR3 estimated values of metallicity and heliocentric distance. |
| In the text | |
Current usage metrics show cumulative count of Article Views (full-text article views including HTML views, PDF and ePub downloads, according to the available data) and Abstracts Views on Vision4Press platform.
Data correspond to usage on the plateform after 2015. The current usage metrics is available 48-96 hours after online publication and is updated daily on week days.
Initial download of the metrics may take a while.