Fig. 3.
Download original image
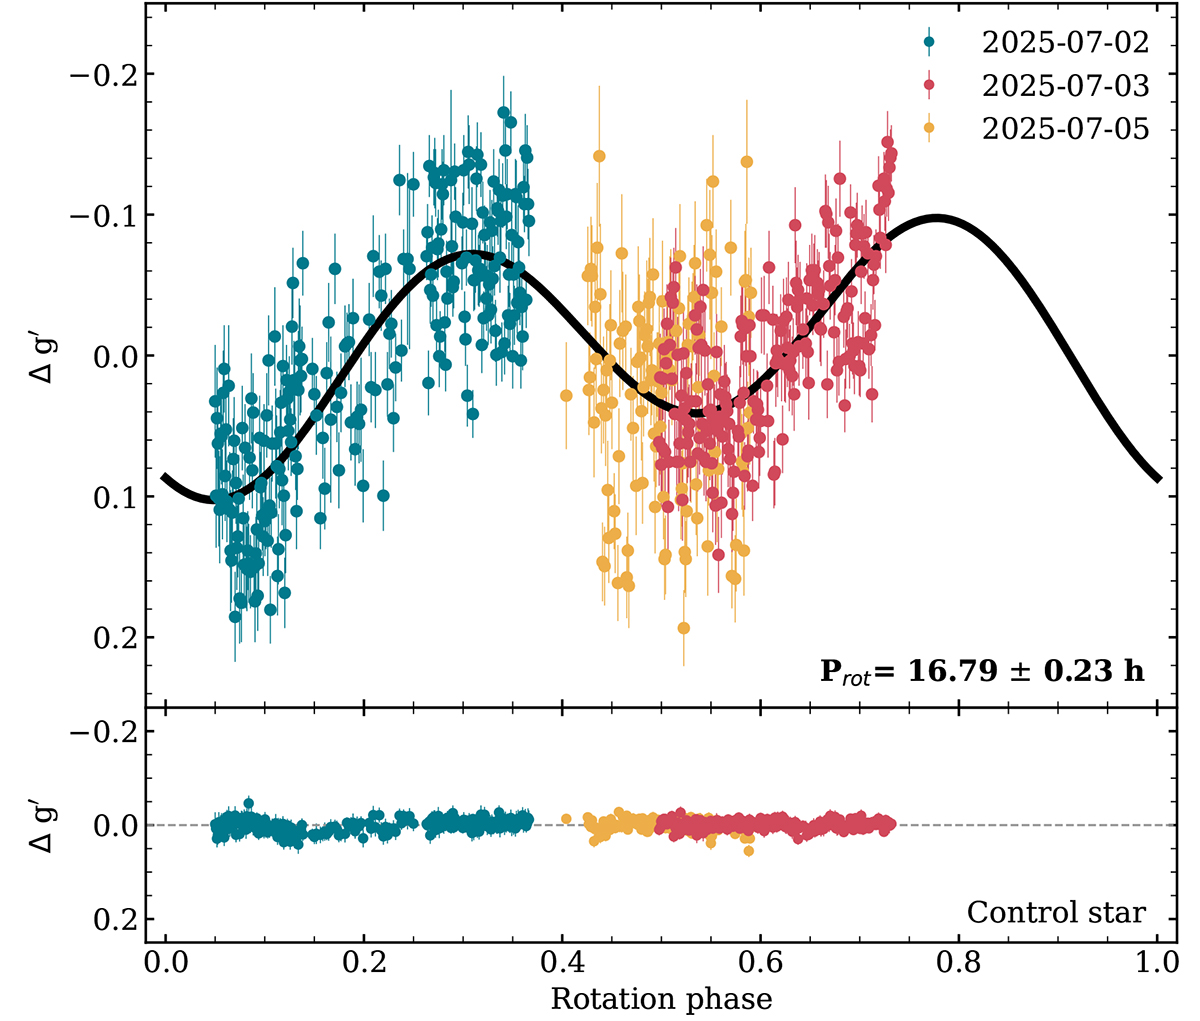
Folded light curve of 3I/ATLAS. The top panel shows the magnitude variation relative to the nightly median, which is, in the g band, 18.76, 18.79, and 18.49, respectively. The black line corresponds to a second-order sinusoidal curve fit with a period obtained from the PDM method. The bottom panel displays the data for a non-variable control star, also normalized by its median magnitude, demonstrating the lack of significant variation in the photometric calibration.
Current usage metrics show cumulative count of Article Views (full-text article views including HTML views, PDF and ePub downloads, according to the available data) and Abstracts Views on Vision4Press platform.
Data correspond to usage on the plateform after 2015. The current usage metrics is available 48-96 hours after online publication and is updated daily on week days.
Initial download of the metrics may take a while.