Open Access
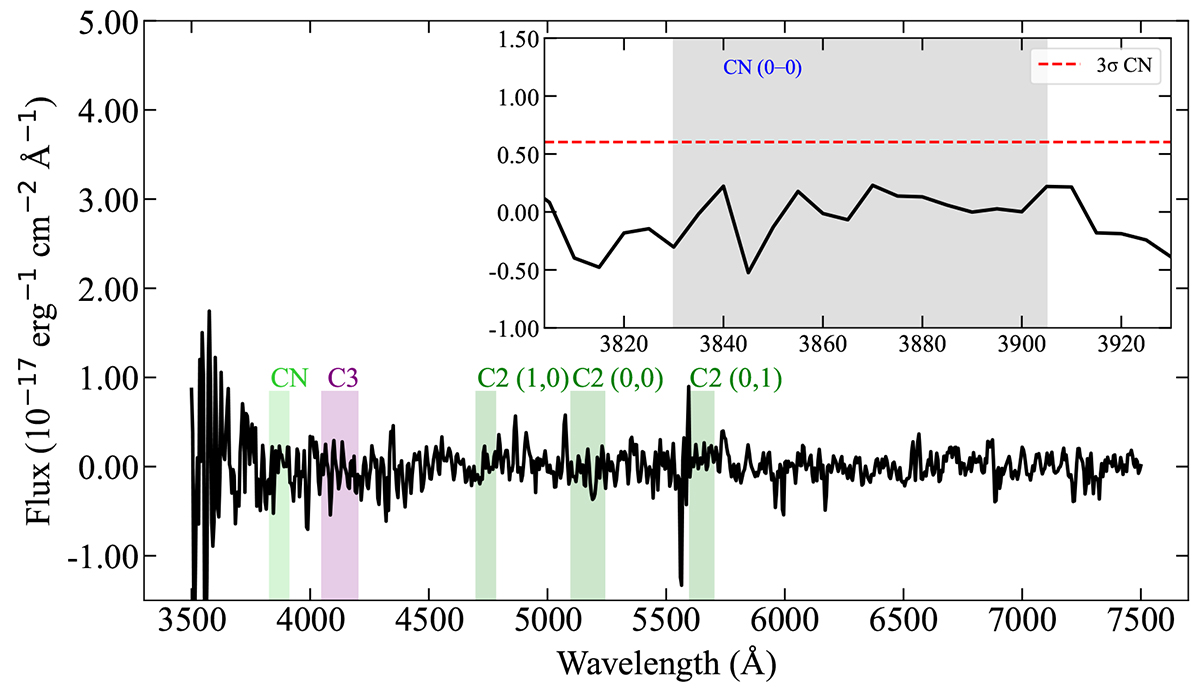
Fig. C.1.
Download original image
The flux spectrum of 3I/ATLAS obtained with OSIRIS at GTC, subtracted from the solar continuum. The most relevant regions were CN, C3 and c2 bands in cometary spectra are shown. In the inset image, a zoom of the CN most prominent cometary emission feature is shown. No significant signal is present in the data.
Current usage metrics show cumulative count of Article Views (full-text article views including HTML views, PDF and ePub downloads, according to the available data) and Abstracts Views on Vision4Press platform.
Data correspond to usage on the plateform after 2015. The current usage metrics is available 48-96 hours after online publication and is updated daily on week days.
Initial download of the metrics may take a while.