Open Access
Fig. D.1.
Download original image
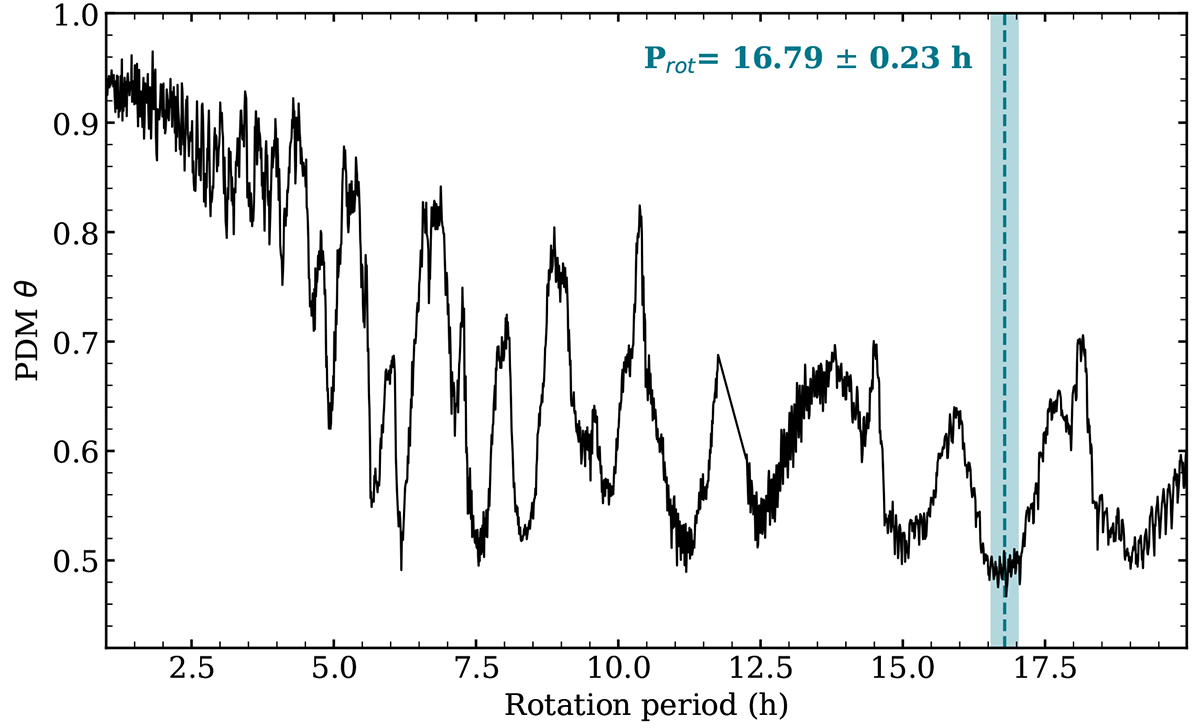
Phase Dispersion Minimization (PDM) Analysis. The PDM theta statistic is plotted against the trial period, with the global minimum identifying the best-fit period of 16.79 ± 0.23 hours, The 1-sigma (FWHM/2.355) uncertainty region, marked by the blue shaded band, was derived from a gaussian fit to the minimum.
Current usage metrics show cumulative count of Article Views (full-text article views including HTML views, PDF and ePub downloads, according to the available data) and Abstracts Views on Vision4Press platform.
Data correspond to usage on the plateform after 2015. The current usage metrics is available 48-96 hours after online publication and is updated daily on week days.
Initial download of the metrics may take a while.