Fig. 3.
Download original image
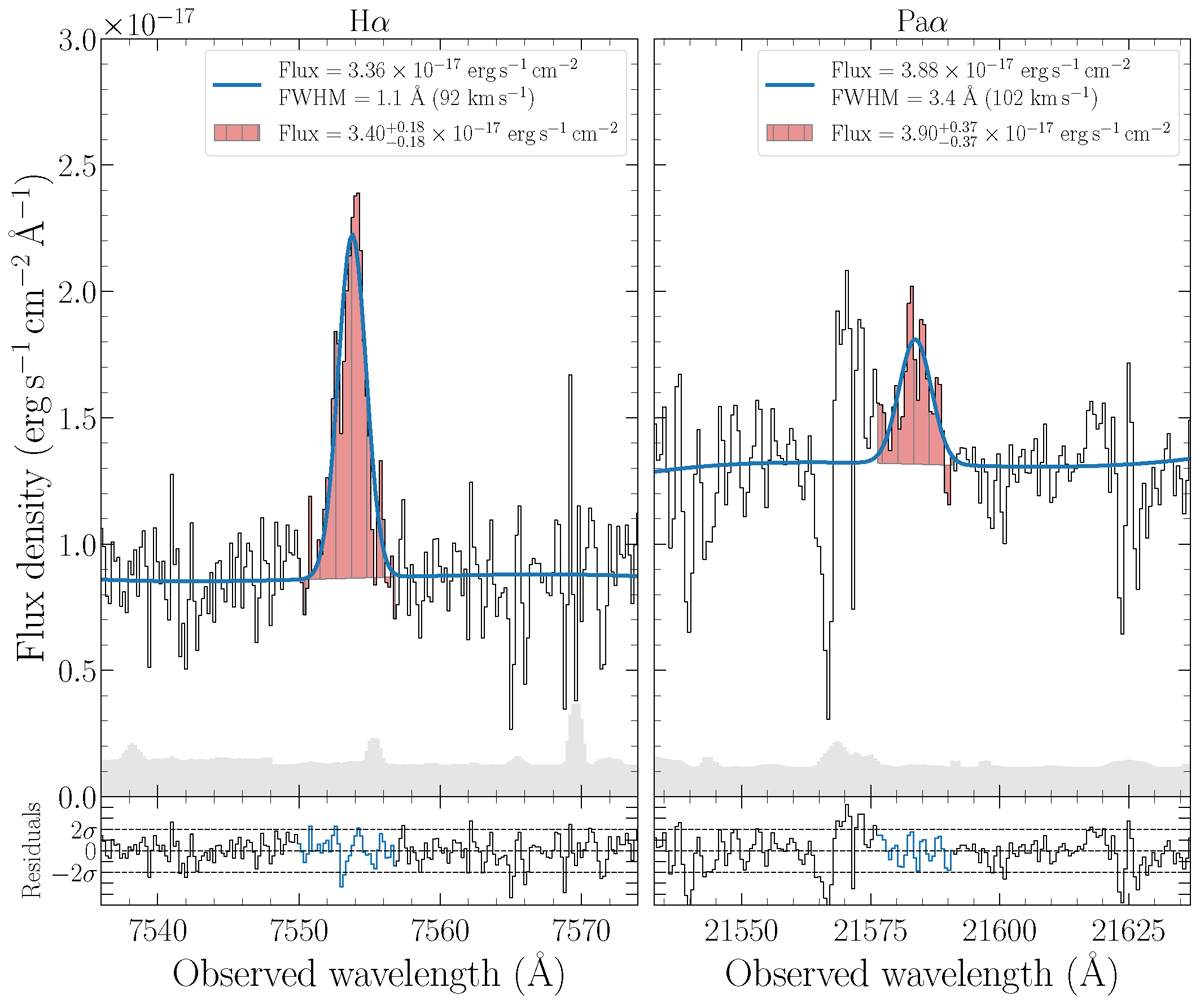
Single-Gaussian fit to the Hα (left) and Paα (right) emission lines. A sky line is responsible for the large residuals blueward of Paα. Top panel: blue line is the result of the fit of the line and the continuum whose fit parameters are reported in the legend (the FWHM is measured in the observer frame). The red shaded area represents the direct integration of the observed flux, whose value is reported in the legend; this is the value used in the calculations throughout the paper. The gray shaded area represents the error spectrum. Bottom panel: normalised residuals. The blue points represent the region where the line is fit.
Current usage metrics show cumulative count of Article Views (full-text article views including HTML views, PDF and ePub downloads, according to the available data) and Abstracts Views on Vision4Press platform.
Data correspond to usage on the plateform after 2015. The current usage metrics is available 48-96 hours after online publication and is updated daily on week days.
Initial download of the metrics may take a while.