| Issue |
A&A
Volume 701, September 2025
|
|
|---|---|---|
| Article Number | A134 | |
| Number of page(s) | 9 | |
| Section | Extragalactic astronomy | |
| DOI | https://doi.org/10.1051/0004-6361/202346146 | |
| Published online | 05 September 2025 | |
The brightest GRB ever detected: GRB 221009A as a highly luminous event at z = 0.151
1
Department of Astrophysics/IMAPP, Radboud University, 6525 AJ Nijmegen, The Netherlands
2
Cosmic Dawn Center (DAWN), Copenhagen, Denmark
3
Niels Bohr Institute, University of Copenhagen, Jagtvej 128, 2200 Copenhagen N, Denmark
4
Department of Physics, University of Warwick, CV4 7AL Coventry, United Kingdom
5
DARK, Niels Bohr Institute, University of Copenhagen Jagtvej 128, 2200 Copenhagen N, Denmark
6
Artemis, Université Côte d’Azur, Observatoire de la Côte d’Azur, CNRS, F-06304 Nice, France
7
INAF, Osservatorio Astronomico di Brera, via E. Bianchi 46, I-23807 Merate (LC), Italy
8
INFN – Sezione di Milano-Bicocca, Piazza della Scienza 3, I-20146 Milano (MI), Italy
9
Hessian Research Cluster ELEMENTS, Giersch Science Center, Max-von-Laue-Strasse 12, Goethe University Frankfurt, Campus Riedberg, 60438 Frankfurt am Main, Germany
10
Astrophysics Research Institute, Liverpool John Moores University, 146 Brownlow Hill, Liverpool L3 5RF, UK
11
GEPI, Observatoire de Paris, Université PSL, CNRS, 5 Place Jules Janssen, 92190 Meudon, France
12
INAF, Istituto di Astrofisica Spaziale e Fisica cosmica, Via Alfonso Corti 12, I-20133 Milano (MI), Italy
13
School of Physics and Astronomy, University of Leicester, University Road, LE1 7RH Leicester, United Kingdom
14
Instituto de Astrofísica de Andalucía – CSIC, Glorieta de la Astronomía s/n, 18008 Granada, Spain
15
European Space Agency (ESA), European Space Research and Technology Centre (ESTEC), Keplerlaan 1, 2201 AZ Noordwijk, The Netherlands
16
ASI – Italian Space Agency, Space Science Data Centre, Via del Politecnico snc, 00133 Rome, Italy
17
INAF, Osservatorio Astronomico di Capodimonte, Salita Moiariello 16, 80131 Napoli, Italy
18
Department of Mathematics, Informatics, Physics and Earth Sciences, University of Messina, Via F. D’Alcontres 31, Papardo, Messina 98166, Italy
19
School of Physics and Astronomy & Institute for Gravitational Wave Astronomy, University of Birmingham, Birmingham B15 2TT, United Kingdom
20
Department of Physics and Astronomy, Kinard Lab of Physics, Clemson University, Clemson, SC 29634, USA
21
Centre for Astrophysics and Cosmology, Science Institute, University of Iceland, Dunhagi 5, 107 Reykjavík, Iceland
22
INAF–Osservatorio di Astrofisica e Scienza dello Spazio, Via Piero Gobetti 93/3, 40024 Bologna, Italy
23
Astronomical Institute Anton Pannekoek, University of Amsterdam, 1090 GE Amsterdam, The Netherlands
24
Department of Physics, University of Bath, Bath BA2 7AY, United Kingdom
25
Kavli Institute for Astrophysics and Space Research, Massachusetts Institute of Technology, 77 Massachusetts Ave, Cambridge, MA 02139, USA
26
The Oskar Klein Centre, Department of Astronomy, Stockholm University, AlbaNova, SE-106 91 Stockholm, Sweden
27
Astronomical Institute of the Czech Academy of Sciences, Fričova 298, 251 65 Ondřejov, Czech Republic
28
Department of Physics, George Washington University, 725 21st St NW, Washington, DC 20052, USA
29
Physics Department, Lancaster University, Lancaster LA1 4YB, United Kingdom
30
Key Laboratory of Space Astronomy, National Astronomical Observatories, Chinese Academy of Sciences, Beijing 100101, China
31
School of Mathematical and Physical Sciences, Macquarie University, NSW 2109, Australia
⋆ Corresponding author: This email address is being protected from spambots. You need JavaScript enabled to view it.
Received:
15
February
2023
Accepted:
9
June
2024
Abstract
Context. The extreme luminosity of gamma-ray bursts (GRBs) makes them powerful beacons, thus effective probes of the distant Universe. The most luminous bursts are typically detected at moderate and high redshift, where the volume for seeing such rare events is maximized and the star-formation activity is greater than at z = 0. For distant events, not all observations are feasible, such as those at TeV energies.
Aims. Here we present a spectroscopic redshift measurement for the exceptional GRB 221009A, the brightest GRB observed to date, with emission extending well into the TeV regime.
Methods. We used the X-shooter spectrograph at the ESO Very Large Telescope (VLT) to obtain simultaneous optical to near-infrared (NIR) spectroscopy of the burst afterglow 0.5 days after the explosion.
Results. The spectra exhibit both absorption and emission lines from material in a host galaxy at zGRB = 0.15095 ± 0.00005. Thus, GRB 221009A was a relatively nearby burst with a luminosity distance of dL = 745 Mpc. Its host galaxy properties (star-formation rate and metallicity) are consistent with those of long GRB hosts at low redshift. This redshift measurement yields information on the energy of the burst. The inferred isotropic energy release, Eiso > 5 × 1054 erg, lies at the high end of the distribution, making GRB 221009A one of the nearest and also most energetic GRBs observed to date. We estimate that such a combination (nearby as well as intrinsically bright) occurs between once every few decades and once per millennium.
Key words: gamma-ray burst: general / gamma-ray burst: individual: GRB 221009A
Deceased.
© The Authors 2025
 Open Access article, published by EDP Sciences, under the terms of the Creative Commons Attribution License (https://creativecommons.org/licenses/by/4.0), which permits unrestricted use, distribution, and reproduction in any medium, provided the original work is properly cited.
This article is published in open access under the Subscribe to Open model. This email address is being protected from spambots. You need JavaScript enabled to view it. to support open access publication.
1. Introduction
The population of so-called “long-duration” gamma-ray bursts (GRBs), which form via the collapse of massive stars and typically have prompt phase durations in the range of ∼2–1000 s, constitute the most luminous events in the known Universe (e.g., Kann et al. 2007; Racusin et al. 2008; Bloom et al. 2009; Frederiks et al. 2013). They have been detected from a redshift of as small as z = 0.01 (Galama et al. 1998) to z = 8 (Tanvir et al. 2009; Salvaterra et al. 2009; Tanvir et al. 2018) and possibly beyond z = 9 (Cucchiara et al. 2011). Their apparent isotropic-equivalent energies also span a large range. The observed local (z ≲ 0.2) burst population is typically of low luminosity, with energies (assuming isotropic emission) of Eiso ∼ 1048–1050 erg (e.g., Soderberg et al. 2004). This reflects the fact that the space density of low-luminosity events is much higher than that of energetic ones. In contrast, at high redshift, we are able to sample a much larger volume, where the GRB rate is enhanced compared to the local Universe because of the increase in cosmic star formation. This allows us to detect those comparatively rare GRBs with an isotropic energy release that is higher by up to six orders of magnitude (Eiso > 1054 erg; e.g., Cenko et al. 2011). The range of GRB luminosities reflects some observational effects, such as the angle between our line of sight and the axis of the geometrically beamed relativistic jet, but it is also likely that the conditions of the progenitor star at the point of core collapse impact the properties of the subsequent GRB.
Studies of GRBs in the relatively local Universe are of particular value because their proximity offers diagnostics that are typically not available for the more distant events. For example, as the supernovae (SNe) associated with GRBs peak at much fainter magnitudes than the GRB afterglows themselves (especially in the UV), we can study the associated SNe in detail only at z < 0.3 (Hjorth & Bloom 2012; Cano et al. 2017; Schulze et al. 2014; D’Elia et al. 2015). Similarly, the lower luminosity distances and better spatial resolution enable studies of their host galaxies and underlying stellar populations in considerably greater detail (e.g., Izzo et al. 2017; Krühler et al. 2017; Tanga et al. 2018; de Ugarte Postigo et al. 2020).
Here we consider the case of GRB 221009A, the brightest GRB observed in over five decades of wide-field-of-view gamma-ray sky monitoring. The detection of TeV photons from this GRB (Dzhappuev et al. 2022; LHAASO Collaboration 2023; Cao et al. 2023) is also unprecedented, both in terms of their energy and flux, making the distance to this event of particular significance, because the mean free path of such photons is limited by their interactions with background light photons (Gilmore et al. 2012; Franceschini & Rodighiero 2017). Our X-shooter spectroscopy of the burst provides a robust redshift measurement of z = 0.151, consistent with being a cosmological GRB and not a transient originating in the Milky Way (MW) as its location on the sky may suggest. The implied luminosity distance1 of dL = 745 Mpc places GRB 221009A amongst the most energetic GRBs ever observed, and makes it by far the closest GRB with Eiso > 1054 erg.
2. Observations
2.1. High-energy discovery
GRB 221009A was detected at 2022 October 9 at 13:16:59 UT by a raft of high-energy missions including Fermi/GBM (Veres et al. 2022; Lesage et al. 2023), Fermi/LAT (Bissaldi et al. 2022), AGILE/MCAL and GRID (Ursi et al. 2022; Piano et al. 2022; Tavani et al. 2023), INTEGRAL (Gotz et al. 2022; Rodi & Ubertini 2023), Konus/Wind (Frederiks et al. 2022, 2023), INSIGHT/HMXT (Tan et al. 2022; Kann et al. 2023), STPSat-6/SIRI-2 (Mitchell et al. 2022), SATech-01/GECAM-C HEBS (Liu et al. 2022), SRG/ART-XC (Lapshov et al. 2022), Solar Orbiter/STIX (Xiao et al. 2022), and GRBalpha (Ripa et al. 2022; Řípa et al. 2023). However, the event was first reported by a Swift detection of the afterglow over 50 minutes later (Dichiara et al. 2022b). The location of the burst within the Galactic plane (l = 52.96°, b = 4.32°), combined with its brightness, led to confusion over the nature of the outburst: initially it was suspected to be due to a new Galactic X-ray transient (Dichiara et al. 2022b,a), but its subsequent behavior, together with the Fermi/GBM and LAT detections, appeared more like that of an extragalactic GRB (Kennea & Williams 2022; Veres et al. 2022; Bissaldi et al. 2022).
Despite high foreground extinction (Sect. 3.2), an optical afterglow was seen by various telescopes (e.g., Dichiara et al. 2022b; Lipunov et al. 2022; Fulton et al. 2023 and many more). The counterpart was localized at coordinates (J2000):  (2),
(2),  (7) by the VLBA at 15.2 GHz (Atri et al. 2022).
Detections with several high-energy instruments have also been reported, including GeV emission with Fermi/LAT (potentially up to 400 GeV; Xia et al. 2024), TeV emission extending to 18 TeV from LHAASO (LHAASO Collaboration 2023), and even a suggestion of a possible association with a 250 TeV photon (Dzhappuev et al. 2022).
2.2. X-shooter spectroscopy
Following the detection of GRB 221009A, and motivated by the significant ambiguity in its distance (Galactic versus extragalactic), we initiated observations with the European Southern Observatory Very Large Telescope (ESO VLT Unit 3, Melipal) located on Cerro Paranal (Chile) and the X-shooter spectrograph (Vernet et al. 2011). These observations began on 2022 October 10 at 00:49:26 UT (11.54 hr after the Fermi trigger). The source brightness at this time, as measured in our acquisition image, was r′ = 17.42 ± 0.05 mag (AB, calibrated against nearby stars from the Pan-STARRS catalog). A summary of the X-shooter spectroscopic observations is presented in Table 1.
Log of X-shooter spectroscopic observations.
Because of the limited target visibility, the airmass at the time of the observation was sizeable, but within the working range of the X-shooter atmospheric dispersion corrector (ADC). Observations were executed using the ABBA nod-on-slit mode, with a nod throw of about 6″ along the slit. Each single arm spectrum was reduced in “stare” mode and using the standard X-shooter pipeline (Goldoni et al. 2006; Modigliani et al. 2010), with the extraction window at the position of the GRB afterglow trace, and background windows at both sides of the spectral trace. Then, for each exposure, residual sky features were interpolated using the background as reference (Selsing et al. 2019). Flux calibration was performed in two steps, first by applying the response function determined via observations of spectrophotometric standard stars, and then renormalizing the flux-calibrated spectra to the available photometry using the g, i, and H bands for the UVB, VIS, and NIR arms, respectively, interpolated at the mean time of the spectrum. Magnitudes were computed from images secured with the X-shooter acquisition camera or taken from a broader photometric set (Brivio et al. 2022; de Ugarte Postigo et al., in prep.). Finally, we applied a telluric correction built using a line-by-line radiative transfer model (LBLRTM; Clough et al. 1992) and the atmospheric properties, such as humidity, temperature, pressure, and zenith angle, which are stored in the header of each exposure.
The observations reveal a very bright trace in the red and infrared that is strongly attenuated toward the blue end by the high Galactic extinction. Figure 1 shows the overall shape of the spectrum and the inner panels zoom in on selected features. We subsequently obtained further X-shooter observations to follow the afterglow evolution. These are discussed in detail by de Ugarte Postigo et al. (in prep.). Among the late spectra, here we only present the 8 × 480 s spectrum, which has a mid time of 2022 October 20 00:20:01 UT and provides the best detection of the emission features (Fig. 1 and Sect. 3.3).
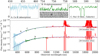 |
Fig. 1. Our X-shooter spectra of the afterglow of GRB 221009A on 2022 October 10 and 20. For clarity, the spectra shown in the bottom panel have been rebinned by a factor of 10 (first epoch) and 40 (second epoch). The UVB, VIS, and NIR arms are color coded in cyan, green, and red, respectively. The blue dashed lines show a power law with a spectral index of β = 0.8 (Fν ∝ ν−β), extinguished by a foreground extinction of AV = 4.177 mag, assuming the MW extinction law from Cardelli et al. (1989). The solid black lines show a bluer β = 0.4 spectrum with AV = 4.7 mag, and provide a slightly better description of the data. The upper panels show zoomed-in regions around the Ca II absorption and Hα emission at z = 0.151 (the afterglow continuum was digitally subtracted from the 2D plot) as well as the Na I D absorption complex due to dust in the MW. |
The results reported in this paper supersede our preliminary analysis (de Ugarte Postigo et al. 2022; Izzo et al. 2022). Our spectroscopic measurement was subsequently confirmed by Castro-Tirado et al. (2022).
3. Results
3.1. Absorption line system and redshift
In addition to several Galactic absorption features at z = 0, we identify a series of absorption lines including Ca II (4530, 4570 Å), Ca I (4867 Å), and Na I (6782, 6789 Å) at redshift z ≈ 0.151. Unfortunately, at this low redshift, most of the strong metal lines are too far into the UV to be detected from the ground, and so we cannot carry out any in-depth analysis of the GRB host ISM.
We first analyzed the absorption features imprinted from the host-galaxy ISM on the afterglow spectrum. To this end, we used the Python package VoigtFit (Krogager 2018). This code creates a convolved spectrum based on the observed spectral resolution of the X-shooter spectra and simultaneously fits for the redshift zGRB, broadening parameter b, and column density of each line complex. We tie the redshift to be identical across the five detected transitions in the optical (see Table 2). The best-fit redshift is zGRB = 0.15095 ± 0.00005. We also find that a single broadening parameter b = 18.5 ± 5.0 km s−1 is able to reproduce the observed line profiles (see Fig. 2), with total column densities of log (NCa II/cm−2) > 15.5, log (NCa I/cm−2) = 12.19 ± 0.08, and log (NCa I/cm−2) = 12.21 ± 0.01. We note that the Ca II transitions are both saturated, and so the inferred column densities are quoted as 3σ lower limits.
Host absorption lines identified in the first X-shooter spectrum, with their measured equivalent widths (observer frame) and column densities.
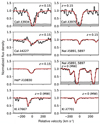 |
Fig. 2. Zoomed-in view of selected absorption features in velocity space. The gray-shaded areas show the error spectrum, while the red lines indicate the best-fit model. The K I 7667 Å line is affected by telluric absorption and was not used for the column density determination. |
We further note the presence of a well-detected absorption feature in the NIR arm observed at 12 468 Å, which we cannot associate with any telluric or Galactic transition. However, it matches the He I* 10 830 Å (unresolved) triplet at z = 0.151. The line profile reveals that the redshift and Doppler broadening of this particular feature are not consistent with the main ones described above, likely suggesting a different physical origin. From the best-fit Voigt profile, we find zHeI* = 0.15089 ± 0.00003, b = 40.9 ± 1.3 km s−1, and a column density with  . This feature was also identified by Fynbo et al. (2014) in the peculiar afterglow of GRB 150406A at z = 0.889, and is also visible in the absorption spectrum of GRB 190114C at z = 0.425 (de Ugarte Postigo et al. 2020).
3.2. Extinction
The line of sight to GRB 221009A goes through significant foreground extinction from dust in the MW and potentially also within its host galaxy. The large foreground extinction is highlighted by strong absorption features seen at z = 0, such as K I and the strongly saturated Na I D (Fig. 1). In Fig. 1, we overplot the X-shooter spectra with a single power law with index β = 0.8 (Fν ∝ ν−β; the same as observed in the X-ray afterglow, e.g., Williams et al. 2023) with a foreground extinction of AV = 4.177 mag (Schlafly & Finkbeiner 2011). This provides a reasonable description of the observations, but substantially over-predicts the measured flux in the red. This suggests the presence of additional extinction, either in the MW (a small underestimate, particularly toward the plane of the MW, is not unlikely) or due to additional dust inside the host galaxy. Given the low redshift of the event and the diversity of the extinction laws (Pei 1992), disentangling host from foreground extinction is nontrivial, but the overall results are relatively insensitive to the dust location. A better match to the data can be obtained with a larger total AV. However, in this case the intrinsic spectral slope must be substantially bluer, matching the preferred results of Kann et al. (2023) and Levan et al. (2023) well. A Monte Carlo Markov Chain sampling of the data using a single power-law source with extinction described by a Fitzpatrick (1999) extinction law returns AV = 4.9 mag and RV = 3.225, with negligible host-galaxy extinction, and a power law with a spectral index of β = 0.21. This would be consistent with the presence of a cooling break lying between the X-ray and optical/IR band.
We also note that there is a significant revision in the foreground extinction between the map of Schlegel et al. (1998) and the recalibration of Schlafly & Finkbeiner (2011), which we have adopted, with the former value of AV = 4.8 mag overall being consistent with our higher extinction scenario. Further insight into the dust location can be provided by the detection of Na I D at z = 0.151, which is often considered a dust tracer. Following Poznanski et al. (2012) and using the EWs from Table 2, we derive  mag, suggesting that indeed a (modest) amount of dust is present in the GRB host galaxy along its line of sight, but that extra dust is also present in the MW, in excess of the Schlafly & Finkbeiner (2011) estimate.
3.3. Host galaxy
In addition to absorption lines, our X-shooter spectroscopy shows two emission lines from the underlying host galaxy. We detect Hα (in the visible) and Paα (in the NIR), while we cannot satisfactorily recover the bluer O III] λ5007, O III] λ4959, Hβ, or [O II] λλ3726, 3729, presumably due to the higher foreground extinction. A small spatial offset is observed between the afterglow trace and the Hα emission line, which is consistent with the extension seen in Hubble Space Telescope imaging of the field (Levan et al. 2022, 2023; Fulton et al. 2023; Shrestha et al. 2023; see also Blanchard et al. 2024). This also implies that the measured fluxes are lower limits, as there is likely emission from regions not covered by the instrument slit. The slit was 0.9″ (1.1″) wide in the optical (NIR), and was oriented along the N–S direction, only partially covering the extended host galaxy. Line-flux ratios are however robust against slit losses. The flux of the detected lines was determined by fitting the continuum around each line and integrating the continuum-subtracted flux over the region of the line. We additionally fitted each detected line with a Gaussian profile, checking the consistency between the two values. The fits are shown in Fig. 3. We also computed an upper limit for [N II] λ6584 as the flux of a Gaussian line with the same velocity width as Hα and an amplitude equal to the noise estimated over the region where the line should lie.
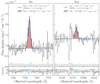 |
Fig. 3. Single-Gaussian fit to the Hα (left) and Paα (right) emission lines. A sky line is responsible for the large residuals blueward of Paα. Top panel: blue line is the result of the fit of the line and the continuum whose fit parameters are reported in the legend (the FWHM is measured in the observer frame). The red shaded area represents the direct integration of the observed flux, whose value is reported in the legend; this is the value used in the calculations throughout the paper. The gray shaded area represents the error spectrum. Bottom panel: normalised residuals. The blue points represent the region where the line is fit. |
The fluxes were then corrected for Galactic dust extinction using AV = 4.177 mag and the MW extinction curve of Pei (1992). We determined the host galaxy AV comparing the observed and theoretical ratio of the Hα and Paα lines (F(Hα)/F(Paα) = 8.56) in the case B recombination scenario, with an electron temperature of 10 000 K and a density of 104 cm−3 (Osterbrock & Ferland 2006). This method yields  mag, where the uncertainties are computed with Monte Carlo error propagation. As with the afterglow SED, it is not possible to disentangle whether this extra extinction is due to dust in the MW or in the GRB host, but this has little effect on our estimate given the low redshift of the object. All the fluxes and their corrected values are shown in Table 3.
Fluxes of the host emission lines measured in the X-shooter spectrum from October 20.
Using the dust-corrected Hα flux and the relation of Kennicutt (1998), we infer a star-formation rate (SFR) of  , scaled to the initial mass function of Chabrier (2003), setting z = 0.1510 and a standard Planck Collaboration VI (2020) cosmology. Due to slit losses, this value should be considered as a lower limit.
Using the upper limit on the [N II] λ6584 line, we can infer an upper limit on the metallicity of the host galaxy using the strong line calibrations of Maiolino et al. (2008), and taking 12 + log(O/H)⊙ = 8.69 (Asplund et al. 2009). We find 12 + log(O/H) < 8.5 which is subsolar and is comparable to the typical metallicities found using the same method in long GRB hosts (Krühler et al. 2015; Japelj et al. 2016; Palmerio et al. 2019).
4. Discussion
4.1. Robustness of redshift
Given the challenges of explaining VHE emission from z = 0.151, it is relevant to consider whether or not there are other, lower redshift possibilities able to explain the burst. The presence of narrow absorption lines implies that the light from the GRB is passing through cool, low-velocity gas moving at a recessional velocity of ∼45 000 km s−1. This is well beyond any plausible peculiar velocities for more local galaxies, or possible velocities of individual gas clouds within them. Although outflows (e.g., from SNe) can achieve high velocities, most do not reach 45 000 km s−1, and in this case we would then expect to observe broad lines. Furthermore, the presence of narrow emission lines at z = 0.151 demonstrates that a star-forming galaxy at this redshift underlies the GRB position. The detection of a SN akin to SN 1998bw (Blanchard et al. 2024) further confirms the redshift value reported in this work.
We estimate the chance alignment probability Pchance between the afterglow and the galaxy using the formula presented by Bloom et al. (2002). Using HST imaging, Levan et al. (2023) report a 0.25″ angular separation between the host centroid and the afterglow, and a host effective radius of ≈1″. In this case, it is the latter quantity that should be used to compute Pchance. Using the host magnitude F625W = 24.88 AB, and correcting for the foreground extinction, we find Pchance = 1–1.5 × 10⁻³, where the uncertainty comes from the unknown proportion of extinction within the MW. Independent of this, the chance alignment is very small, further solidifying the association with the galaxy and confirming the robustness of the GRB redshift identification.
Formally, we note that the detection of narrow absorption lines only places a lower limit on the burst redshift of z = 0.151. The redshift is such that we cannot detect individual variable fine-structure lines pumped by the UV emission from the GRB (e.g., Vreeswijk et al. 2004). It is plausible that the burst could be at even higher redshift. A higher redshift would ameliorate rate constraints, and could even be lensed by the z = 0.151 system (although such a scenario is very unlikely). However, placing the burst at an even higher redshift would only exacerbate the challenges of VHE emission and extreme prompt isotropic energy release. The lack of any detected features at redshifts of higher than z = 0.151 (including across wavelength ranges with high S/N) also argues against z > 0.151.
4.2. Energetics and implications
GRB 221009A is by far the brightest GRB ever observed (Burns et al. 2023c). Measurements of both the peak flux and fluence are underestimated because it was sufficiently bright to saturate many of the detectors, but even allowing for this, GRB 221009A was a factor of 40 more fluent than the next-brightest well-studied burst at the time2, GRB 130427A (Ackermann et al. 2014; Preece et al. 2014; Maselli et al. 2014).
Estimating the precise isotropic energy release of GRB 221009A is nontrivial because of the difficulty in correcting for saturation effects. However, estimates of the fluence lie in the range ≈(1 − 9)×10−2 erg cm−2 (Gotz et al. 2022; Lesage et al. 2022; Frederiks et al. 2022; Kann & Agui Fernandez 2022) and the burst isotropic energy release in the 0.1 keV–100 MeV “ultrabolometric” band (Agüí Fernández et al. 2023) is at least Eiso = 5.9 × 1054 erg (Kann & Agui Fernandez 2022). In addition to being one of the closest, this makes GRB 221009A one of the most intrinsically energetic GRBs ever observed. If a more detailed saturation correction analysis yields a true fluence of ≳10−1 erg cm−2, GRB 221009A could well also be the most energetic GRB ever observed, at least within the sample of GRBs with known redshift.
4.3. Rates
The combination of proximity and brightness or energy release raises the question of just how unusual GRB 221009A is. To place this GRB in context, we compared it with long GRB events (i.e., those with T90 > 2 s) previously observed by Fermi/GBM. In general, it is relevant to consider both the peak flux and the fluence. While the peak flux is normally more relevant for triggering, in the case of GRB 221009A it is also likely more difficult to correct for saturation compared to fluence. We thus considered both the “bolometric” 1–10 000 keV band fluence3 and the peak count rates, calculated with 1024 ms binning, summed over all NaI detectors and all channels. To construct the latter, we downloaded all trigdata files related to long GRBs from the Fermi/GBM trigger catalog4 and used the count-rate data therein. In 98% of cases, peak count rates were reported with a binning of 1024 ms or finer (in which case we downsampled to 1024 ms by summing neighboring bins near the peak). We assumed the remaining 2% of the events to be sampled from the same distribution. From these, we constructed the corresponding inverse cumulative distributions, which are shown in Fig. 4. In order to convert the number of observed events into an all-sky rate, we divided the number by the GBM mission duration (TGBM = 10 yr, as we used only bursts whose spectral information is part of the fourth Fermi/GBM catalog; von Kienlin et al. 2020), and by the effective GBM duty cycle η = 0.598, determined by its limited field of view and downtime, itself attributable to the need to turn off the detectors during the transit through the South Atlantic anomaly (Burns et al. 2016). In order to extrapolate the observed inverse cumulative distribution to the fluence (or count rate) of GRB 221009A, we identified a fluence (or count rate) f0 above which the distribution resembles a single power law and fitted a simple power-law model with index a to the data above that point (excluding GRB 221009A itself). The fit is performed in a Bayesian fashion, as follows. The assumed probability of observing a given fluence (or count rate) fi is p(fi | a) = (a/f0)(f/f0)−a − 1, and therefore the posterior probability on a given the observed fluences (or count rates) is
 (1)
(1)
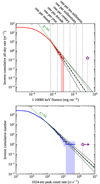 |
Fig. 4. Differential and integrated GRB rates. Top panel: all-sky cumulative rate of long GRBs (i.e., those with T90 > 2 s; thick solid line) observed by Fermi/GBM up to 2018 June above a given 1–10 000 keV fluence, excluding GRB 221009A. The estimated fluence of the latter, ∼0.2 erg cm−2, based on Fermi/GBM (Lesage et al. 2022; Burns et al. 2023c), Konus/Wind (Frederiks et al. 2023), INSIGHT-HXMT, and GECAM-C (An et al. 2023), is shown by the purple star. The shaded area comprises the distributions obtained by varying the observed number by |

where d = {fi}i = 1N0 is our data and π(a) is the prior on a, which we take as uniform in a, π(a)∝1. We set f0 = 10−4 erg cm−2 for fluences and f0 = 104 ct s−1 for count rates. The posterior probability density distributions on a are nearly Gaussian for both the fluence and count rate cases, and yield  for fluences and a ∼ 1.52 ± 0.13 for count rates (median and symmetric 68% credible interval). While the slope in both cases is close to a = 3/2, which is expected for homogeneously distributed sources in Euclidean space, this is not, in this case, indicating such a distribution, but is caused by the increase in the GRB rate with redshift (∝(1 + z)3.2; Ghirlanda & Salvaterra 2022), which, in this calculation, cancels out the effect of the expansion of the Universe. Given the power-law scaling, the expected all-sky rate of events above a fluence (or count rate) f⋆ is simply
 (2)
(2)
Figure 4 shows the resulting expected rate extrapolation, which is compared to the GRB 221009A bolometric fluence f⋆ ∼ 0.2 erg cm−2 (Frederiks et al. 2023; Burns et al. 2023c) and to its peak count rate of f⋆ = 1.7 × 10⁶ ct s−1 obtained as explained above. The latter is a lower limit because of the saturation in the NaI detectors.
Taking the values corresponding to the 90th percentiles of the posterior distributions, we estimate a rate of less than 1 event in 4210 years (fluences) or 70 years (peak count rate) as bright as or brighter than GRB 221009A. The former value is much lower than that found by Atteia (2022), owing to the fact that we employ a bolometric, saturation-corrected estimate of the brightness of this burst.
Given these expected rates, the probability of observing at least one event with Fermi/GBM, assuming Poisson statistics, is given by
 (3)
(3)
which yields p(N(f ≥ f⋆) > 0 | d)∼6.8 × 10⁻⁴ using the fluences, and p(N(f ≥ f⋆)> 0 | d)≲0.064 using the count rates. Again, the latter must be taken as an upper limit due to saturation. These values confirm that GRB 221009A is a very rare event, in agreement with Burns et al. (2023c).
4.4. Estimate based on a GRB population model
We also provide an estimate of the rate of GRB 221009A-like events based on the state-of-the-art model for the population of long GRBs described in Ghirlanda & Salvaterra (2022). This model predicts the intrinsic properties of the population of long GRBs, such as their luminosity function and cosmic rate, as obtained by reproducing the observed distributions of the properties of bursts detected by Fermi/GBM and CGRO/BATSE, and the distributions of rest-frame properties of a flux-limited sample of bright GRBs detected by Swift/BAT (Salvaterra et al. 2012). By sampling the posterior distribution of the model population parameters (Table 1 in Ghirlanda & Salvaterra 2022), we estimated the probability of occurrence of an event with an isotropic-equivalent luminosity L ≥ L⋆ within a redshift of z ≤ z⋆, where L⋆ = 1054 erg s−1 (Burns et al. 2023c) and z⋆ = 0.15 correspond to the values of GRB 221009A. With these values, we sampled the population model posterior probability and derived a mean rate of 1 every 18 400 yr (or 1 every 3150 yr as 90th percentile estimate).
In the entirety of 55 years of GRB observations, no event has been reported that even comes close to GRB 221009A in terms of fluence (Burns et al. 2023c). Prior to GRB 221009A, GRB 130427A was very likely the most fluent GRB of the combined CGRO/BATSE, Konus/Wind, and Fermi/GBM era beginning in 1991, which is well documented and readily publicly available (Paciesas et al. 1999; Kaneko et al. 2006; Nava et al. 2011; Goldstein et al. 2013; Tsvetkova et al. 2017, 2021; Ajello et al. 2019; von Kienlin et al. 2020). More recently, Fermi detected another high-fluence event, namely GRB 230307A with a preliminary estimate of the fluence of ∼3 × 10⁻³ erg cm−2 (Dalessi & Fermi GBM Team 2023), comparable to that of GRB 130427A and also a very rare (once per few decades) event (Burns et al. 2023b; Levan et al. 2024).
The situation for the first ∼25 years of GRB studies is less transparent, but there are several events with fluences similar to that of GRB 130427A, namely the famous GRB 830801B (Kuznetsov et al. 1986, 1987; Schaefer et al. 2001), the significantly less well-documented GRB 840304 (Klebesadel et al. 1984; Itoh et al. 1985), and two events detected by the Pioneer Venus Orbiter (PVO), GRBs 920212 and 900808 (the latter mentioned in Fenimore et al. 1996 as the brightest GRB in terms of peak flux detected by PVO). However, none of these events had a fluence in excess of 10−2 erg cm−2, and so GRB 221009A is potentially more than ten times as fluent as any other GRB ever detected (Burns et al. 2023c).
4.5. VHE emission
One of the most striking features of the detection of GRB 221009A is the identification of very high-energy emission. In particular, the LHAASO water Cherenkov observatory reported the detection of more than 5000 TeV photons associated with the burst (Huang et al. 2022; LHAASO Collaboration 2023; Cao et al. 2023), with a highest energy photon at 18 TeV. The Carpet-2 experiment detected a possible 250 TeV photon (Dzhappuev et al. 2022).
Knowledge of the redshift is critical for the interpretation of these observations, because TeV photons scatter off the extragalactic background light (EBL) photons or even – at the very highest energies – off the cosmic microwave background (CMB) photons. The EBL is the result of photons from essentially every photon emitter in the Universe, and is therefore, in addition to the CMB, of important cosmological utility. These photon scatterings result in progressively higher opacity for photons of increasing energy. The detection of high-energy TeV photons is therefore a valuable route to probing models for the EBL.
Indeed, the detection of such emission from GRB 221009A at z = 0.151 is particularly intriguing. For example, by reconstructing the expected intrinsic emission from blazars, Domínguez et al. (2013) estimated the effective horizon as a function of photon energy: at 18 TeV this horizon (corresponding to an optical depth of 1, or an attenuation factor of 0.63) lies at z < 0.01, while at z = 0.15, τ ≫ 3 (attenuation > 0.95). In practice, the situation is less severe, because the uncertainty associated with the highest-energy photons is significant (formally Cao et al. 2023 find  TeV) and because alternative, nonphotonic (e.g., muon) origins cannot be robustly ruled out. However, there remains some tension that may be suggestive of either lower-than-expected opacity in the EBL or new physics (Cao et al. 2023; Galanti et al. 2023).
Knowledge of the redshift also provides robust constraints on the total neutrino luminosity for the GRB. Intensive study of candidate neutrino tracks in the IceCube experiment provided no evidence for any neutrino excess in the MeV, TeV, and PeV energy ranges Abbasi et al. (2023). Indeed, because of the proximity and high-energy emission (the processes for which can also create neutrinos), constraints on neutrino production for GRB 221009A are as strong as those from stacked analyses of larger numbers of bursts (Murase et al. 2022), and begin to provide meaningful constraints on at least some physical parameters within the fireball (e.g., bulk Lorentz factor and dissipation radius; see Murase et al. 2022; Abbasi et al. 2023).
5. Conclusions
We present a measurement of the redshift of GRB 221009A with the VLT/X-shooter. Our observations allow us to measure z = zGRB = 0.15095 ± 0.00005, demonstrating that GRB 221009A is not only the brightest GRB ever seen (in terms of flux and fluence) but is also intrinsically one of the most energetic.
From the fluxes of a few emission lines detected on top of the afterglow spectrum, we are also able to constrain the SFR, metallicity, and dust content of the host galaxy. The values found are consistent with those of GRB host galaxies at low redshift.
In addition to the large tabulated amount of extinction in the direction of the GRB due to the MW (AV = 4.177 mag), we detect extra absorption (by ≈0.5 mag). From the shape of the afterglow SED, the fluxes of the host emission lines, and the detection of Na I in absorption, we suggest that about 0.15 mag of extinction is located in the GRB host, with the remaining lying in the MW.
Our analysis suggests that a burst this close and this luminous should only be witnessed at best once every few decades, and may be as rare as a once-per-millennium event, depending on its actual flux and fluence values.
Assuming a flat ΛCDM cosmology with H0 = 67.4 km s−1 Mpc−1 and Ωm = 0.315 (Planck Collaboration VI 2020).
During the review process of this paper, another very bright event was observed, which has now become the second brightest detected GRB; (Burns et al. 2023a).
We used the information available in the online Fermi/GBM catalog, accessible at https://heasarc.gsfc.nasa.gov/W3Browse/fermi/fermigbrst.html, focusing on bursts detected up to November 26 2018, which were published in the fourth Fermi/GBM catalog (von Kienlin et al. 2020). For bursts with available spectral information, we used the best-fitting spectral model (as reported in the flnc_best_fitting_model column) with the reported best-fit parameters to compute the bolometric fluence. For the remaining ∼5.8% of the bursts, we used the 10–1000 keV value reported in the fluence column, which is a good approximation of the bolometric fluence, assuming the peak of the νFν spectrum is below 1000 keV.
Acknowledgments
We dedicate this paper to the memory of our beloved colleagues David Alexander “Alex” Kann, who was especially fond of this unique GRB. We are grateful for a constructive report from an anonymous referee. This paper is based on observations collected at the European Southern Observatory under ESO programme 110.24CF (PI Tanvir). We thank the support from the ESO observing staff in Paranal, in particular Cédric Ledoux, Matias Jones, Michael Abdul-Masih, Zahed Wahhaj. PDA acknowledge funding from the Italian Space Agency, contract ASI/INAF n. I/004/11/4 and from PRIN-MIUR 2017 (grant 20179ZF5KS). DAK acknowledges the support by the State of Hessen within the Research Cluster ELEMENTS (Project ID 500/10.006). DBM, AJL and NRT are supported by the European Research Council (ERC) under the European Union’s Horizon 2020 research and innovation programme (grant agreement No. 725246). The Cosmic Dawn Center is supported by the Danish National Research Foundation. JH and LI were supported by a VILLUM FONDEN Investigator grant (project number 16599). EPi acknowledges financial support through an INAF research grant. MER acknowledges support from the research programme Athena with project number 184.034.002, which is financed by the Dutch Research Council (NWO). AS and SDV acknowledge support from DIM-ACAV+. KW acknowledges support through a UK Research and Innovation Future Leaders Fellowship awarded to Dr. B. Simmons (MR/T044136/1). DX acknowledges the science research grants from the China Manned Space Project with NO. CMS-CSST-2021-A13 and CMS-CSST-2021-B11.
References
- Abbasi, R., Ackermann, M., Adams, J., et al. 2023, ApJ, 946, L26 [Google Scholar]
- Ackermann, M., Ajello, M., Asano, K., et al. 2014, Science, 343, 42 [NASA ADS] [CrossRef] [Google Scholar]
- Agüí Fernández, J. F., Thöne, C. C., Kann, D. A., et al. 2023, MNRAS, 520, 613 [CrossRef] [Google Scholar]
- Ajello, M., Arimoto, M., Axelsson, M., et al. 2019, ApJ, 878, 52 [NASA ADS] [CrossRef] [Google Scholar]
- An, Z. H., Antier, S., Bi, X. Z., et al. 2023, ArXiv e-prints [arXiv:2303.01203] [Google Scholar]
- Asplund, M., Grevesse, N., Sauval, A. J., & Scott, P. 2009, ARA&A, 47, 481 [NASA ADS] [CrossRef] [Google Scholar]
- Atri, P., An, T., Giroletti, M., et al. 2022, GRB Coordinates Network, 32907 [Google Scholar]
- Atteia, J. L. 2022, GRB Coordinates Network, 32793 [Google Scholar]
- Bissaldi, E., Omodei, N., Kerr, M., & Fermi-LAT Team 2022, GRB Coordinates Network, 32637 [Google Scholar]
- Blanchard, P. K., Villar, V. A., Chornock, R., et al. 2024, Nature Astronomy, 8, 774 [Google Scholar]
- Bloom, J. S., Kulkarni, S. R., & Djorgovski, S. G. 2002, AJ, 123, 1111 [NASA ADS] [CrossRef] [Google Scholar]
- Bloom, J. S., Perley, D. A., Li, W., et al. 2009, ApJ, 691, 723 [NASA ADS] [CrossRef] [Google Scholar]
- Brivio, R., Ferro, M., D’Avanzo, P., et al. 2022, GRB Coordinates Network, 32652 [Google Scholar]
- Burns, E., Connaughton, V., Zhang, B.-B., et al. 2016, ApJ, 818, 110 [NASA ADS] [CrossRef] [Google Scholar]
- Burns, E., Goldstein, A., Lesage, S., & Dalessi, S. 2023a, GRB Coordinates Network, 33414, 1 [Google Scholar]
- Burns, E., Goldstein, A., Lesage, S., Dalessi, S., & Fermi-GBM Team 2023b, GRB Coordinates Network, 33414, 1 [Google Scholar]
- Burns, E., Svinkin, D., Fenimore, E., et al. 2023c, ApJ, 946, L31 [NASA ADS] [CrossRef] [Google Scholar]
- Cano, Z., Wang, S.-Q., Dai, Z.-G., & Wu, X.-F. 2017, Advances in Astronomy, 2017, 8929054 [Google Scholar]
- Cao, Z., Aharonian, F., An, Q., et al. 2023, Science Advances, 9, eadj2778 [Google Scholar]
- Cardelli, J. A., Clayton, G. C., & Mathis, J. S. 1989, ApJ, 345, 245 [Google Scholar]
- Castro-Tirado, A. J., Sanchez-Ramirez, R., Hu, Y. D., et al. 2022, GRB Coordinates Network, 32686 [Google Scholar]
- Cenko, S. B., Frail, D. A., Harrison, F. A., et al. 2011, ApJ, 732, 29 [NASA ADS] [CrossRef] [Google Scholar]
- Chabrier, G. 2003, PASP, 115, 763 [Google Scholar]
- Clough, S. A., Iacono, M. J., & Moncet, J.-L. 1992, J. Geophys. Res., 97, 15761 [NASA ADS] [CrossRef] [Google Scholar]
- Cucchiara, A., Levan, A. J., Fox, D. B., et al. 2011, ApJ, 736, 7 [Google Scholar]
- Dalessi, S., & Fermi GBM Team 2023, GRB Coordinates Network, 33407, 1 [Google Scholar]
- de Ugarte Postigo, A., Thöne, C. C., Martín, S., et al. 2020, A&A, 633, A68 [EDP Sciences] [Google Scholar]
- de Ugarte Postigo, A., Izzo, L., Pugliese, G., et al. 2022, GRB Coordinates Network, 32648 [Google Scholar]
- D’Elia, V., Pian, E., Melandri, A., et al. 2015, A&A, 577, A116 [NASA ADS] [CrossRef] [EDP Sciences] [Google Scholar]
- Dichiara, S., Gropp, J. D., Kennea, J. A., et al. 2022a, The Astronomer’s Telegram, 15650 [Google Scholar]
- Dichiara, S., Gropp, J. D., Kennea, J. A., et al. 2022b, GRB Coordinates Network, 32632 [Google Scholar]
- Domínguez, A., Finke, J. D., Prada, F., et al. 2013, ApJ, 770, 77 [CrossRef] [Google Scholar]
- Dzhappuev, D. D., Afashokov, Y. Z., Dzaparova, I. M., et al. 2022, The Astronomer’s Telegram, 15669 [Google Scholar]
- Fenimore, E. E., Klebesadel, R. W., & Laros, J. G. 1996, ApJ, 460, 964 [NASA ADS] [CrossRef] [Google Scholar]
- Fitzpatrick, E. L. 1999, PASP, 111, 63 [Google Scholar]
- Franceschini, A., & Rodighiero, G. 2017, A&A, 603, A34 [NASA ADS] [CrossRef] [EDP Sciences] [Google Scholar]
- Frederiks, D., Lysenko, A., Ridnaia, A., et al. 2022, GRB Coordinates Network, 32668 [Google Scholar]
- Frederiks, D., Svinkin, D., Lysenko, A. L., et al. 2023, ApJ, 949, L7 [NASA ADS] [CrossRef] [Google Scholar]
- Frederiks, D. D., Hurley, K., Svinkin, D. S., et al. 2013, ApJ, 779, 151 [Google Scholar]
- Fulton, M. D., Smartt, S. J., Rhodes, L., et al. 2023, ApJ, 946, L22 [NASA ADS] [CrossRef] [Google Scholar]
- Fynbo, J. P. U., Krühler, T., Leighly, K., et al. 2014, A&A, 572, A12 [NASA ADS] [CrossRef] [EDP Sciences] [Google Scholar]
- Galama, T. J., Vreeswijk, P. M., van Paradijs, J., et al. 1998, Nature, 395, 670 [Google Scholar]
- Galanti, G., Nava, L., Roncadelli, M., Tavecchio, F., & Bonnoli, G. 2023, Phys. Rev. Lett., 131, 251001 [NASA ADS] [CrossRef] [Google Scholar]
- Ghirlanda, G., & Salvaterra, R. 2022, ApJ, 932, 10 [NASA ADS] [CrossRef] [Google Scholar]
- Gilmore, R. C., Somerville, R. S., Primack, J. R., & Domínguez, A. 2012, MNRAS, 422, 3189 [NASA ADS] [CrossRef] [Google Scholar]
- Goldoni, P., Royer, F., François, P., et al. 2006, in SPIE Conf. Ser., eds. I. S. McLean, & M. Iye, 6269, 62692K [NASA ADS] [Google Scholar]
- Goldstein, A., Preece, R. D., Mallozzi, R. S., et al. 2013, ApJS, 208, 21 [Google Scholar]
- Gotz, D., Mereghetti, S., Savchenko, V., et al. 2022, GRB Coordinates Network, 32660 [Google Scholar]
- Hjorth, J., & Bloom, J. S. 2012, Chapter 9 in ”Gamma-Ray Bursts, 169 [Google Scholar]
- Huang, Y., Hu, S., Chen, S., et al. 2022, GRB Coordinates Network, 32677 [Google Scholar]
- Itoh, M., Fenimore, E. E., Fikani, M., et al. 1985, Bulletin of the American Astronomical Society, 17, 850 [Google Scholar]
- Izzo, L., Saccardi, A., Fynbo, J. P. U., et al. 2022, GRB Coordinates Network, 32765 [Google Scholar]
- Izzo, L., Thöne, C. C., Schulze, S., et al. 2017, MNRAS, 472, 4480 [Google Scholar]
- Japelj, J., Vergani, S. D., Salvaterra, R., et al. 2016, A&A, 590, A129 [NASA ADS] [CrossRef] [EDP Sciences] [Google Scholar]
- Kaneko, Y., Preece, R. D., Briggs, M. S., et al. 2006, ApJS, 166, 298 [CrossRef] [Google Scholar]
- Kann, D. A., Agayeva, S., Aivazyan, V., et al. 2023, ApJ, 948, L12 [NASA ADS] [CrossRef] [Google Scholar]
- Kann, D. A., & Agui Fernandez, J. F. 2022, GRB Coordinates Network, 32762 [Google Scholar]
- Kann, D. A., Masetti, N., & Klose, S. 2007, AJ, 133, 1187 [NASA ADS] [CrossRef] [Google Scholar]
- Kennea, J. A., Williams, M., & Swift Team 2022, GRB Coordinates Network, 32635 [Google Scholar]
- Kennicutt, R. C., Jr 1998, ApJ, 498, 541 [Google Scholar]
- Klebesadel, R. W., Laros, J. G., & Fenimore, E. E. 1984, Bulletin of the American Astronomical Society, 16, 1016 [Google Scholar]
- Krogager, J. K. 2018, ArXiv e-prints [arXiv:1803.01187] [Google Scholar]
- Krühler, T., Malesani, D., Fynbo, J. P. U., et al. 2015, A&A, 581, A125 [Google Scholar]
- Krühler, T., Kuncarayakti, H., Schady, P., et al. 2017, A&A, 602, A85 [NASA ADS] [CrossRef] [EDP Sciences] [Google Scholar]
- Kuznetsov, A. V., Syunyaev, R. A., Terekhov, O. V., et al. 1986, Soviet Astronomy Letters, 12, 315 [Google Scholar]
- Kuznetsov, A. V., Sunyaev, R. A., Terekhov, O. V., et al. 1987, Pisma v Astronomicheskii Zhurnal, 13, 1055 [Google Scholar]
- Lapshov, I., Molkov, S., Mereminsky, I., et al. 2022, GRB Coordinates Network, 32663 [Google Scholar]
- Lesage, S., Veres, P., Briggs, M. S., et al. 2023, ApJ, 952, L42 [NASA ADS] [CrossRef] [Google Scholar]
- Lesage, S., Veres, P., Roberts, O. J., et al. 2022, GRB Coordinates Network, 32642 [Google Scholar]
- Levan, A. J., Barclay, T., Bhirombhakdi, K., et al. 2022, GRB Coordinates Network, 32921 [Google Scholar]
- Levan, A. J., Lamb, G. P., Schneider, B., et al. 2023, ApJ, 946, L28 [NASA ADS] [CrossRef] [Google Scholar]
- Levan, A. J., Gompertz, B. P., Salafia, O. S., et al. 2024, Nature, 626, 737 [NASA ADS] [CrossRef] [Google Scholar]
- LHAASO Collaboration (Cao, Z., et al.) 2023, Science, 380, 1390 [NASA ADS] [CrossRef] [Google Scholar]
- Lipunov, V., Kornilov, V., Gorbovskoy, E., et al. 2022, GRB Coordinates Network, 32634 [Google Scholar]
- Liu, J. C., Zhang, Y. Q., Xiong, S. L., et al. 2022, GRB Coordinates Network, 32751 [Google Scholar]
- Maiolino, R., Nagao, T., Grazian, A., et al. 2008, A&A, 488, 463 [NASA ADS] [CrossRef] [EDP Sciences] [Google Scholar]
- Maselli, A., Melandri, A., Nava, L., et al. 2014, Science, 343, 48 [NASA ADS] [CrossRef] [Google Scholar]
- Mitchell, L. J., Phlips, B. F., & Johnson, W. N. 2022, GRB Coordinates Network, 32746 [Google Scholar]
- Modigliani, A., Goldoni, P., Royer, F., et al. 2010, in Observatory Operations: Strategies, Processes, and Systems, eds. D. R. Silva, A. B. Peck, & B. T. Soifer, SPIE Conf. Ser., 7737, 773728 [Google Scholar]
- Murase, K., Mukhopadhyay, M., Kheirandish, A., Kimura, S. S., & Fang, K. 2022, ApJ, 941, L10 [NASA ADS] [CrossRef] [Google Scholar]
- Nava, L., Ghirlanda, G., Ghisellini, G., & Celotti, A. 2011, A&A, 530, A21 [NASA ADS] [CrossRef] [EDP Sciences] [Google Scholar]
- Osterbrock, D. E., & Ferland, G. J. 2006, Astrophysics of Gaseous Nebulae and Active Galactic Nuclei (Sausalito: University Science Books) [Google Scholar]
- Paciesas, W. S., Meegan, C. A., Pendleton, G. N., et al. 1999, ApJS, 122, 465 [NASA ADS] [CrossRef] [Google Scholar]
- Palmerio, J. T., Vergani, S. D., Salvaterra, R., et al. 2019, A&A, 623, A26 [NASA ADS] [CrossRef] [EDP Sciences] [Google Scholar]
- Pei, Y. C. 1992, ApJ, 395, 130 [Google Scholar]
- Piano, G., Verrecchia, F., Bulgarelli, A., et al. 2022, GRB Coordinates Network, 32657 [Google Scholar]
- Planck Collaboration VI 2020, A&A, 641, A6 [NASA ADS] [CrossRef] [EDP Sciences] [Google Scholar]
- Poznanski, D., Prochaska, J. X., & Bloom, J. S. 2012, MNRAS, 426, 1465 [Google Scholar]
- Preece, R., Burgess, J. M., von Kienlin, A., et al. 2014, Science, 343, 51 [Google Scholar]
- Racusin, J. L., Karpov, S. V., Sokolowski, M., et al. 2008, Nature, 455, 183 [Google Scholar]
- Ripa, J., Pal, A., Werner, N., et al. 2022, GRB Coordinates Network, 32685, 1 [Google Scholar]
- Rodi, J., & Ubertini, P. 2023, A&A, 677, L3 [NASA ADS] [CrossRef] [EDP Sciences] [Google Scholar]
- Salvaterra, R., Della Valle, M., Campana, S., et al. 2009, Nature, 461, 1258 [NASA ADS] [CrossRef] [PubMed] [Google Scholar]
- Salvaterra, R., Campana, S., Vergani, S. D., et al. 2012, ApJ, 749, 68 [NASA ADS] [CrossRef] [Google Scholar]
- Schaefer, B. E., Deng, M., & Band, D. L. 2001, ApJ, 563, L123 [Google Scholar]
- Schlafly, E. F., & Finkbeiner, D. P. 2011, ApJ, 737, 103 [Google Scholar]
- Schlegel, D. J., Finkbeiner, D. P., & Davis, M. 1998, ApJ, 500, 525 [Google Scholar]
- Schulze, S., Malesani, D., Cucchiara, A., et al. 2014, A&A, 566, A102 [NASA ADS] [CrossRef] [EDP Sciences] [Google Scholar]
- Selsing, J., Malesani, D., Goldoni, P., et al. 2019, A&A, 623, A92 [NASA ADS] [CrossRef] [EDP Sciences] [Google Scholar]
- Shrestha, M., Sand, D. J., Alexander, K. D., et al. 2023, ApJ, 946, L25 [NASA ADS] [CrossRef] [Google Scholar]
- Soderberg, A. M., Kulkarni, S. R., Berger, E., et al. 2004, Nature, 430, 648 [NASA ADS] [CrossRef] [Google Scholar]
- Tan, W. J., Li, C. K., Ge, M. Y., et al. 2022, The Astronomer’s Telegram, 15660, 1 [Google Scholar]
- Tanga, M., Krühler, T., Schady, P., et al. 2018, A&A, 615, A136 [NASA ADS] [CrossRef] [EDP Sciences] [Google Scholar]
- Tanvir, N. R., Fox, D. B., Levan, A. J., et al. 2009, Nature, 461, 1254 [Google Scholar]
- Tanvir, N. R., Laskar, T., Levan, A. J., et al. 2018, ApJ, 865, 107 [NASA ADS] [CrossRef] [Google Scholar]
- Tavani, M., Piano, G., Bulgarelli, A., et al. 2023, ApJ, 956, L23 [Google Scholar]
- Tsvetkova, A., Frederiks, D., Golenetskii, S., et al. 2017, ApJ, 850, 161 [NASA ADS] [CrossRef] [Google Scholar]
- Tsvetkova, A., Frederiks, D., Svinkin, D., et al. 2021, ApJ, 908, 83 [NASA ADS] [CrossRef] [Google Scholar]
- Ursi, A., Panebianco, G., Pittori, C., et al. 2022, GRB Coordinates Network, 32650 [Google Scholar]
- Veres, P., Burns, E., Bissaldi, E., et al. 2022, GRB Coordinates Network, 32636, 1 [NASA ADS] [Google Scholar]
- Vernet, J., Dekker, H., D’Odorico, S., et al. 2011, A&A, 536, A105 [NASA ADS] [CrossRef] [EDP Sciences] [Google Scholar]
- von Kienlin, A., Meegan, C. A., Paciesas, W. S., et al. 2020, ApJ, 893, 46 [Google Scholar]
- Vreeswijk, P. M., Ellison, S. L., Ledoux, C., et al. 2004, A&A, 419, 927 [NASA ADS] [CrossRef] [EDP Sciences] [Google Scholar]
- Řípa, J., Takahashi, H., Fukazawa, Y., et al. 2023, A&A, 677, L2 [CrossRef] [EDP Sciences] [Google Scholar]
- Williams, M. A., Kennea, J. A., Dichiara, S., et al. 2023, ApJ, 946, L24 [NASA ADS] [CrossRef] [Google Scholar]
- Xia, Z.-Q., Wang, Y., Yuan, Q., & Fan, Y.-Z. 2024, Nature Communications, 15, 4280 [Google Scholar]
- Xiao, H., Krucker, S., & Daniel, R. 2022, GRB Coordinates Network, 32661 [Google Scholar]
All Tables
Host absorption lines identified in the first X-shooter spectrum, with their measured equivalent widths (observer frame) and column densities.
Fluxes of the host emission lines measured in the X-shooter spectrum from October 20.
All Figures
|
Fig. 1. Our X-shooter spectra of the afterglow of GRB 221009A on 2022 October 10 and 20. For clarity, the spectra shown in the bottom panel have been rebinned by a factor of 10 (first epoch) and 40 (second epoch). The UVB, VIS, and NIR arms are color coded in cyan, green, and red, respectively. The blue dashed lines show a power law with a spectral index of β = 0.8 (Fν ∝ ν−β), extinguished by a foreground extinction of AV = 4.177 mag, assuming the MW extinction law from Cardelli et al. (1989). The solid black lines show a bluer β = 0.4 spectrum with AV = 4.7 mag, and provide a slightly better description of the data. The upper panels show zoomed-in regions around the Ca II absorption and Hα emission at z = 0.151 (the afterglow continuum was digitally subtracted from the 2D plot) as well as the Na I D absorption complex due to dust in the MW. |
| In the text | |
|
Fig. 2. Zoomed-in view of selected absorption features in velocity space. The gray-shaded areas show the error spectrum, while the red lines indicate the best-fit model. The K I 7667 Å line is affected by telluric absorption and was not used for the column density determination. |
| In the text | |
|
Fig. 3. Single-Gaussian fit to the Hα (left) and Paα (right) emission lines. A sky line is responsible for the large residuals blueward of Paα. Top panel: blue line is the result of the fit of the line and the continuum whose fit parameters are reported in the legend (the FWHM is measured in the observer frame). The red shaded area represents the direct integration of the observed flux, whose value is reported in the legend; this is the value used in the calculations throughout the paper. The gray shaded area represents the error spectrum. Bottom panel: normalised residuals. The blue points represent the region where the line is fit. |
| In the text | |
|
Fig. 4. Differential and integrated GRB rates. Top panel: all-sky cumulative rate of long GRBs (i.e., those with T90 > 2 s; thick solid line) observed by Fermi/GBM up to 2018 June above a given 1–10 000 keV fluence, excluding GRB 221009A. The estimated fluence of the latter, ∼0.2 erg cm−2, based on Fermi/GBM (Lesage et al. 2022; Burns et al. 2023c), Konus/Wind (Frederiks et al. 2023), INSIGHT-HXMT, and GECAM-C (An et al. 2023), is shown by the purple star. The shaded area comprises the distributions obtained by varying the observed number by |
| In the text | |
Current usage metrics show cumulative count of Article Views (full-text article views including HTML views, PDF and ePub downloads, according to the available data) and Abstracts Views on Vision4Press platform.
Data correspond to usage on the plateform after 2015. The current usage metrics is available 48-96 hours after online publication and is updated daily on week days.
Initial download of the metrics may take a while.