Fig. 4.
Download original image
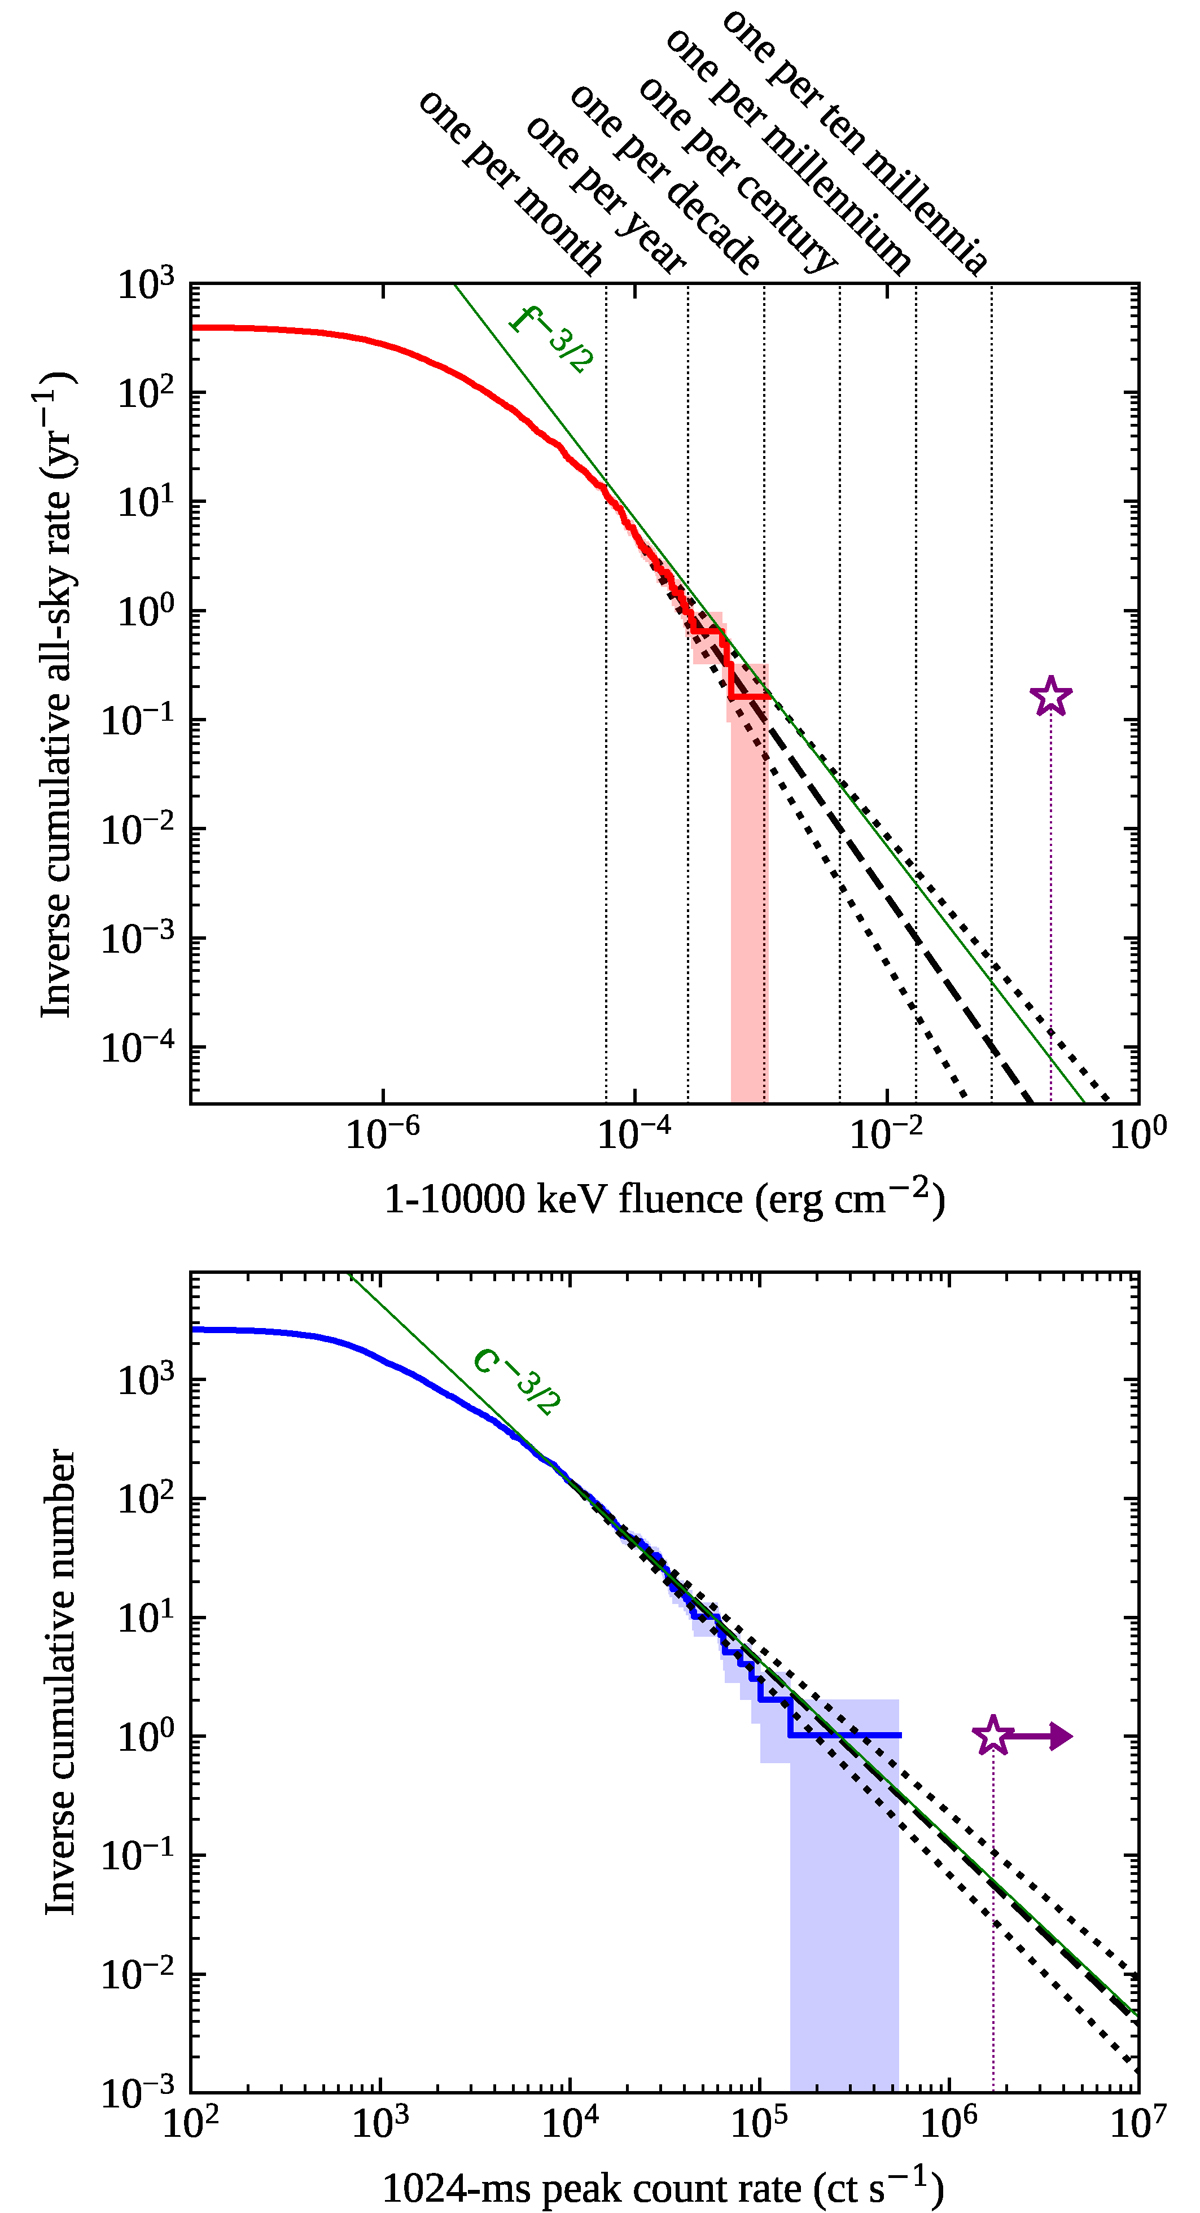
Differential and integrated GRB rates. Top panel: all-sky cumulative rate of long GRBs (i.e., those with T90 > 2 s; thick solid line) observed by Fermi/GBM up to 2018 June above a given 1–10 000 keV fluence, excluding GRB 221009A. The estimated fluence of the latter, ∼0.2 erg cm−2, based on Fermi/GBM (Lesage et al. 2022; Burns et al. 2023c), Konus/Wind (Frederiks et al. 2023), INSIGHT-HXMT, and GECAM-C (An et al. 2023), is shown by the purple star. The shaded area comprises the distributions obtained by varying the observed number by ![]() , where N is the number of bursts in each bin, which approximates the Poisson error. The black dashed line shows the best-fit power-law model N(> f) = N0(f/f0)−a, where f0 = 10−4 erg cm−2 and N0 is the observed rate above f0. The black dotted lines encompass the 68% uncertainty on the power-law index a from such a fit. The thin green line shows the theoretically expected −3/2 scaling for homogeneously distributed sources in Euclidean space although there is no strong expectation that GRBs should follow this distribution (see text). The vertical dotted lines mark the fluxes that correspond to the reported rates according to the best-fit power-law model. Bottom panel: similar to the top panel, but showing the cumulative number of events above a given peak background-subtracted count rate (summed over all channels and all NaI detectors, measured with 1024 ms binning, and not corrected for saturation). In this case, f0 = 104 ct s−1, and the peak count rate of GRB 221009A is a lower limit.
, where N is the number of bursts in each bin, which approximates the Poisson error. The black dashed line shows the best-fit power-law model N(> f) = N0(f/f0)−a, where f0 = 10−4 erg cm−2 and N0 is the observed rate above f0. The black dotted lines encompass the 68% uncertainty on the power-law index a from such a fit. The thin green line shows the theoretically expected −3/2 scaling for homogeneously distributed sources in Euclidean space although there is no strong expectation that GRBs should follow this distribution (see text). The vertical dotted lines mark the fluxes that correspond to the reported rates according to the best-fit power-law model. Bottom panel: similar to the top panel, but showing the cumulative number of events above a given peak background-subtracted count rate (summed over all channels and all NaI detectors, measured with 1024 ms binning, and not corrected for saturation). In this case, f0 = 104 ct s−1, and the peak count rate of GRB 221009A is a lower limit.
Current usage metrics show cumulative count of Article Views (full-text article views including HTML views, PDF and ePub downloads, according to the available data) and Abstracts Views on Vision4Press platform.
Data correspond to usage on the plateform after 2015. The current usage metrics is available 48-96 hours after online publication and is updated daily on week days.
Initial download of the metrics may take a while.