Open Access
Fig. 2.
Download original image
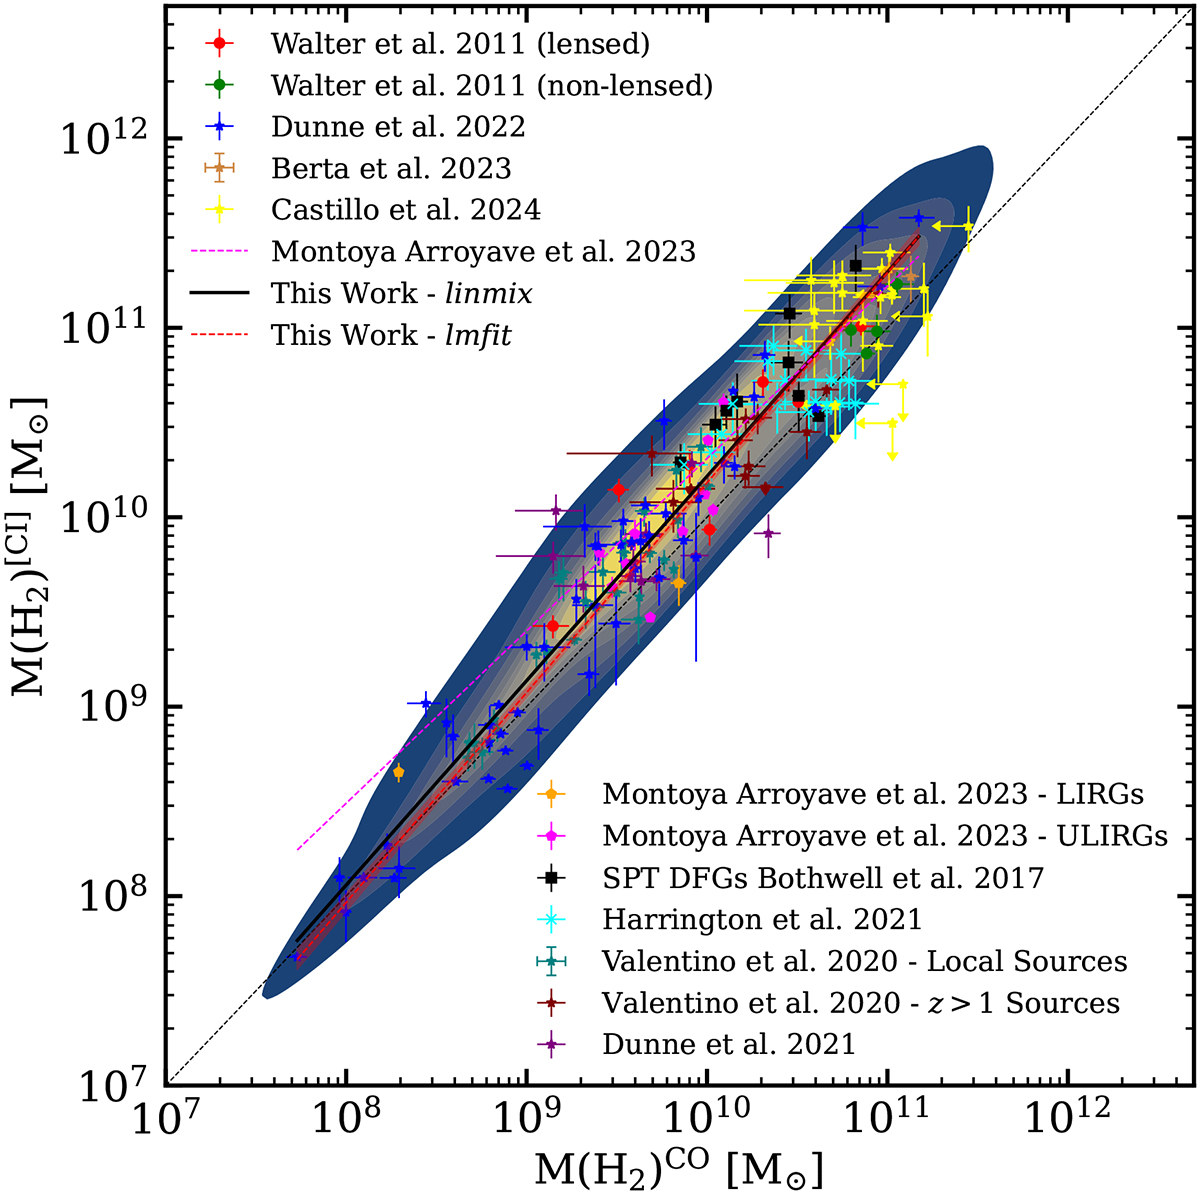
![]() vs.
vs. ![]() plot. The best fit using the lmfit package (red dashed line) and the linmix package (thick black solid line) are presented in the figure. The 1-to-1 line is presented as a dashed black line. Finally, the relation derived in Montoya Arroyave et al. (2023) (
plot. The best fit using the lmfit package (red dashed line) and the linmix package (thick black solid line) are presented in the figure. The 1-to-1 line is presented as a dashed black line. Finally, the relation derived in Montoya Arroyave et al. (2023) (![]() ) is included as a dotted magenta line.
) is included as a dotted magenta line.
Current usage metrics show cumulative count of Article Views (full-text article views including HTML views, PDF and ePub downloads, according to the available data) and Abstracts Views on Vision4Press platform.
Data correspond to usage on the plateform after 2015. The current usage metrics is available 48-96 hours after online publication and is updated daily on week days.
Initial download of the metrics may take a while.