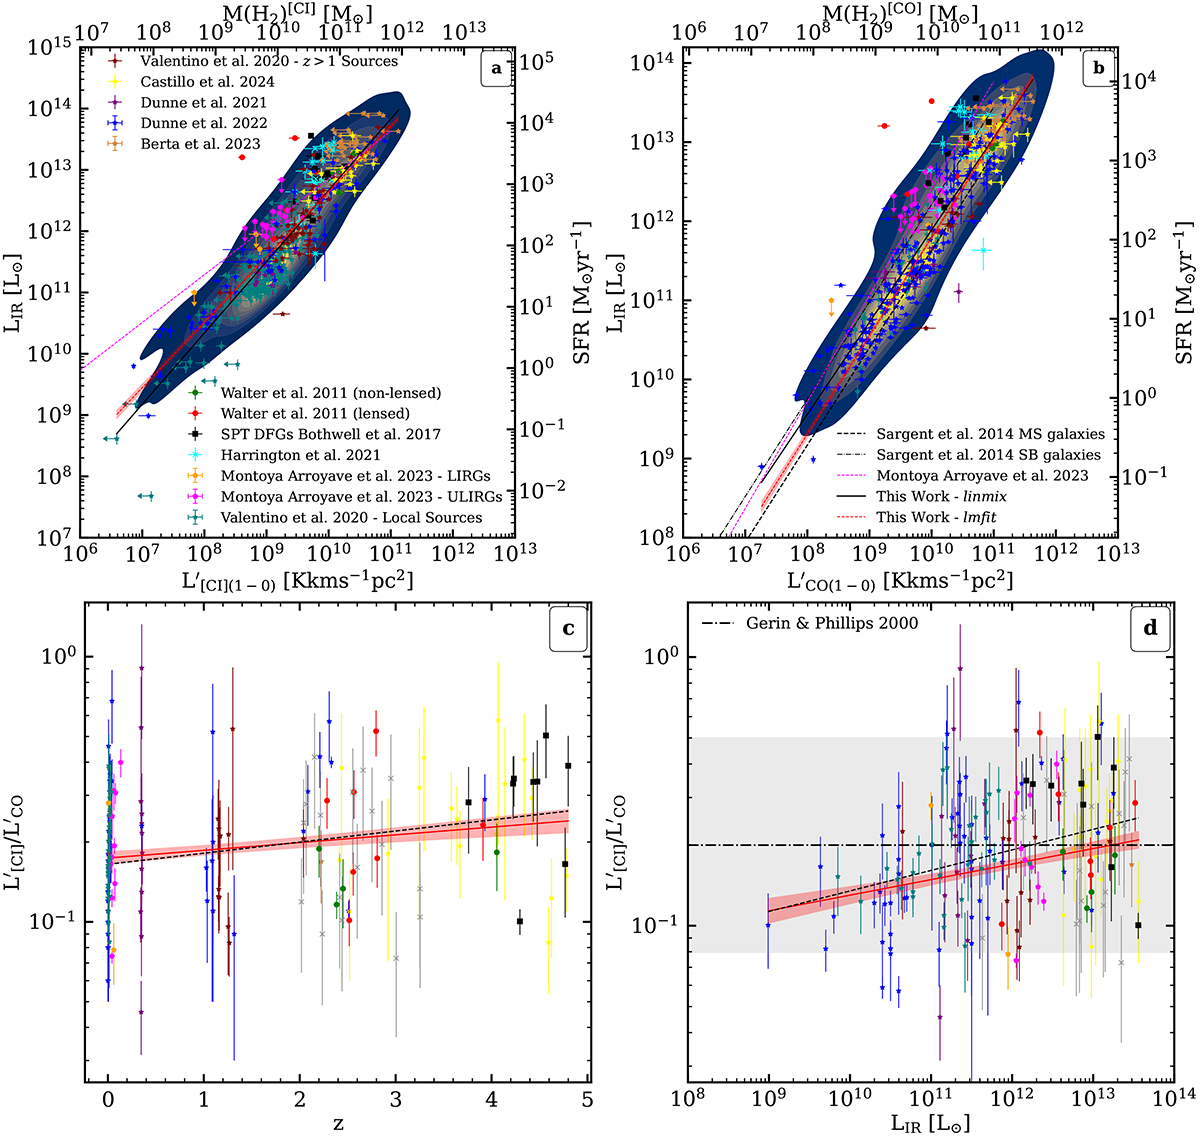
Fig. 3.
Download original image
LIR vs. L′[CI](1 − 0) (panel a), L′CO(1 − 0) (panel b) luminosities, L′[CI](1 − 0)/L′CO(1 − 0) ratio against redshift (panel c), and L′[CI](1 − 0)/L′CO(1 − 0) ratio against LIR (panel d). The secondary y-axis represents the SFR and the secondary x-axis the total molecular masses computed using the corresponding tracer. We include the best fit using the Levenberg–Marquardt algorithm of the lmfit package (red dashed line), and the Bayesian approach to linear regression using the linmix package (solid black line). In panel (b) we include the relations presented in Sargent et al. (2014) for main-sequence galaxies (thick black dashed line), and starburst galaxies (dash-dotted line). In panels (a) and (b), the relations derived in Montoya Arroyave et al. (2023) for CO(1–0) and [C I](1–0) line detections are presented (magenta dashed lines). Panels (c) and (d) include the lmfit and linmix method fits, with solid red and dashed black lines, respectively. In panel (d), the black dash-dotted line presents the mean L′[CI](1 − 0)/L′CO(1 − 0) value and the scatter (gray shaded area) derived by Gerin & Phillips (2000).
Current usage metrics show cumulative count of Article Views (full-text article views including HTML views, PDF and ePub downloads, according to the available data) and Abstracts Views on Vision4Press platform.
Data correspond to usage on the plateform after 2015. The current usage metrics is available 48-96 hours after online publication and is updated daily on week days.
Initial download of the metrics may take a while.