Fig. 2
Download original image
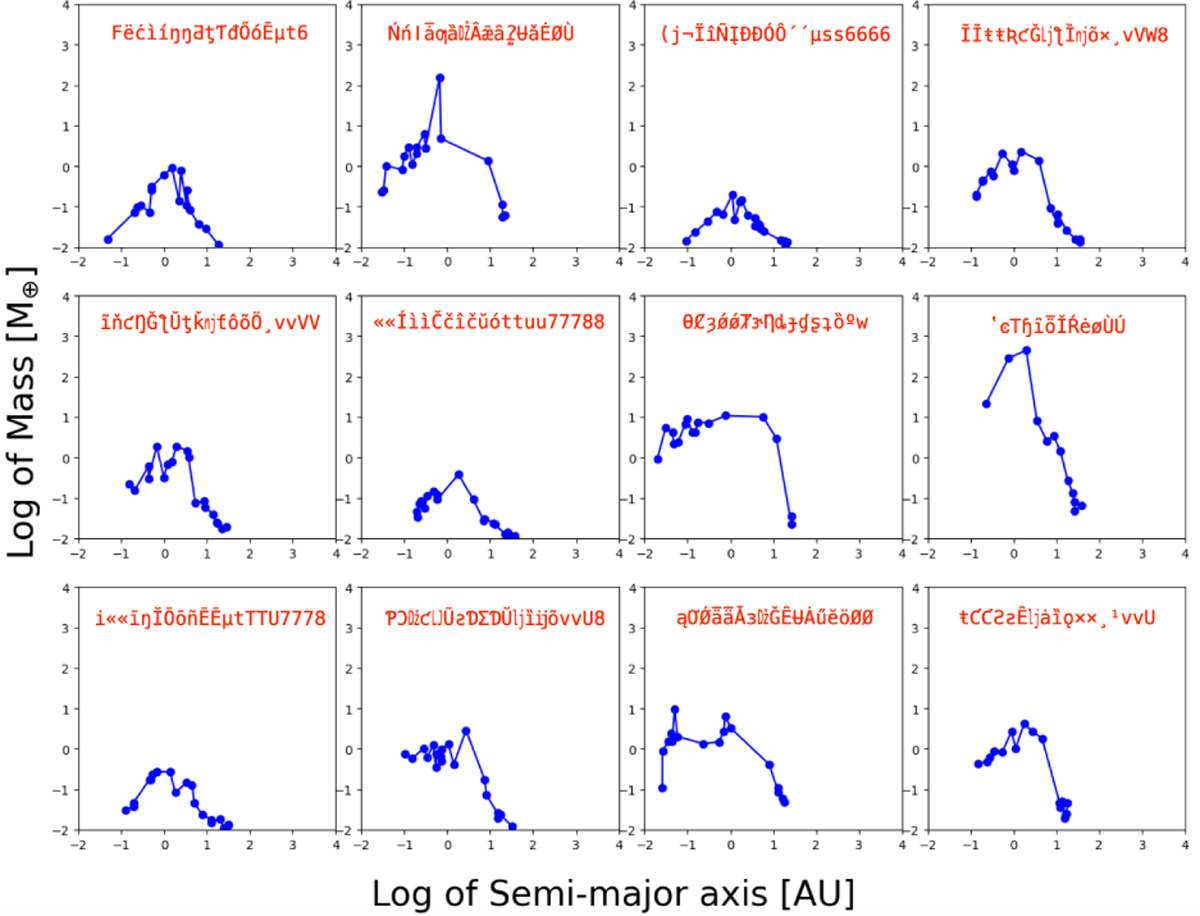
Example of planetary systems belonging to our training database. The x-axis represents the log of the semi-major axis (in AU), the y-axis represents the log of the mass (in Earth masses). Each planetary system is represented as a broken line joining points, themselves representing planets. The characters in red in each of the panels correspond to the encoding of the planetary system into a word (see Sect. 3.1).
Current usage metrics show cumulative count of Article Views (full-text article views including HTML views, PDF and ePub downloads, according to the available data) and Abstracts Views on Vision4Press platform.
Data correspond to usage on the plateform after 2015. The current usage metrics is available 48-96 hours after online publication and is updated daily on week days.
Initial download of the metrics may take a while.