Fig. 8
Download original image
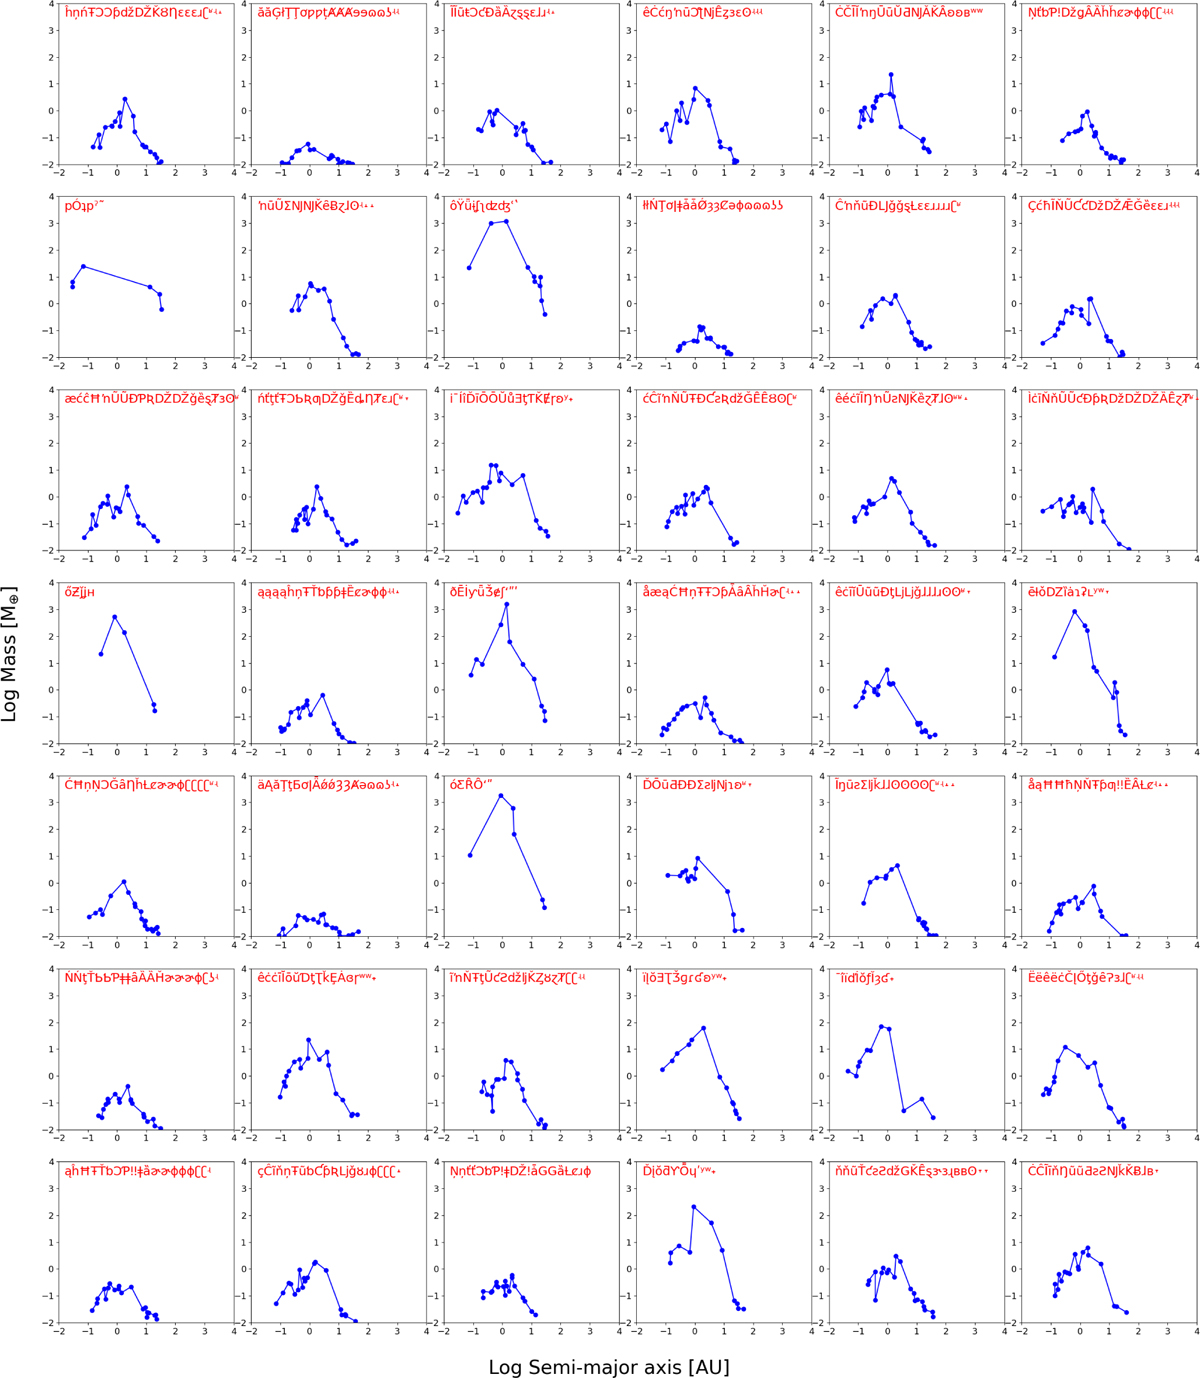
Examples of planetary systems: half generated by our generative model, half from our training dataset. The x-axis represents the log of the semi-major axis (in AU); the y-axis represents the log of the mass (in Earth masses). Each planetary system is represented as a broken line connecting points, with each point representing a planet. The characters in red in each of the panels indicate the encoding of the planetary system (see Sect. 3.1). The exact populations, either generated or from numerical simulations, to which each system belongs is indicated in a footnote in our conclusions (Sect. 6).
Current usage metrics show cumulative count of Article Views (full-text article views including HTML views, PDF and ePub downloads, according to the available data) and Abstracts Views on Vision4Press platform.
Data correspond to usage on the plateform after 2015. The current usage metrics is available 48-96 hours after online publication and is updated daily on week days.
Initial download of the metrics may take a while.