Open Access
Fig. 2
Download original image
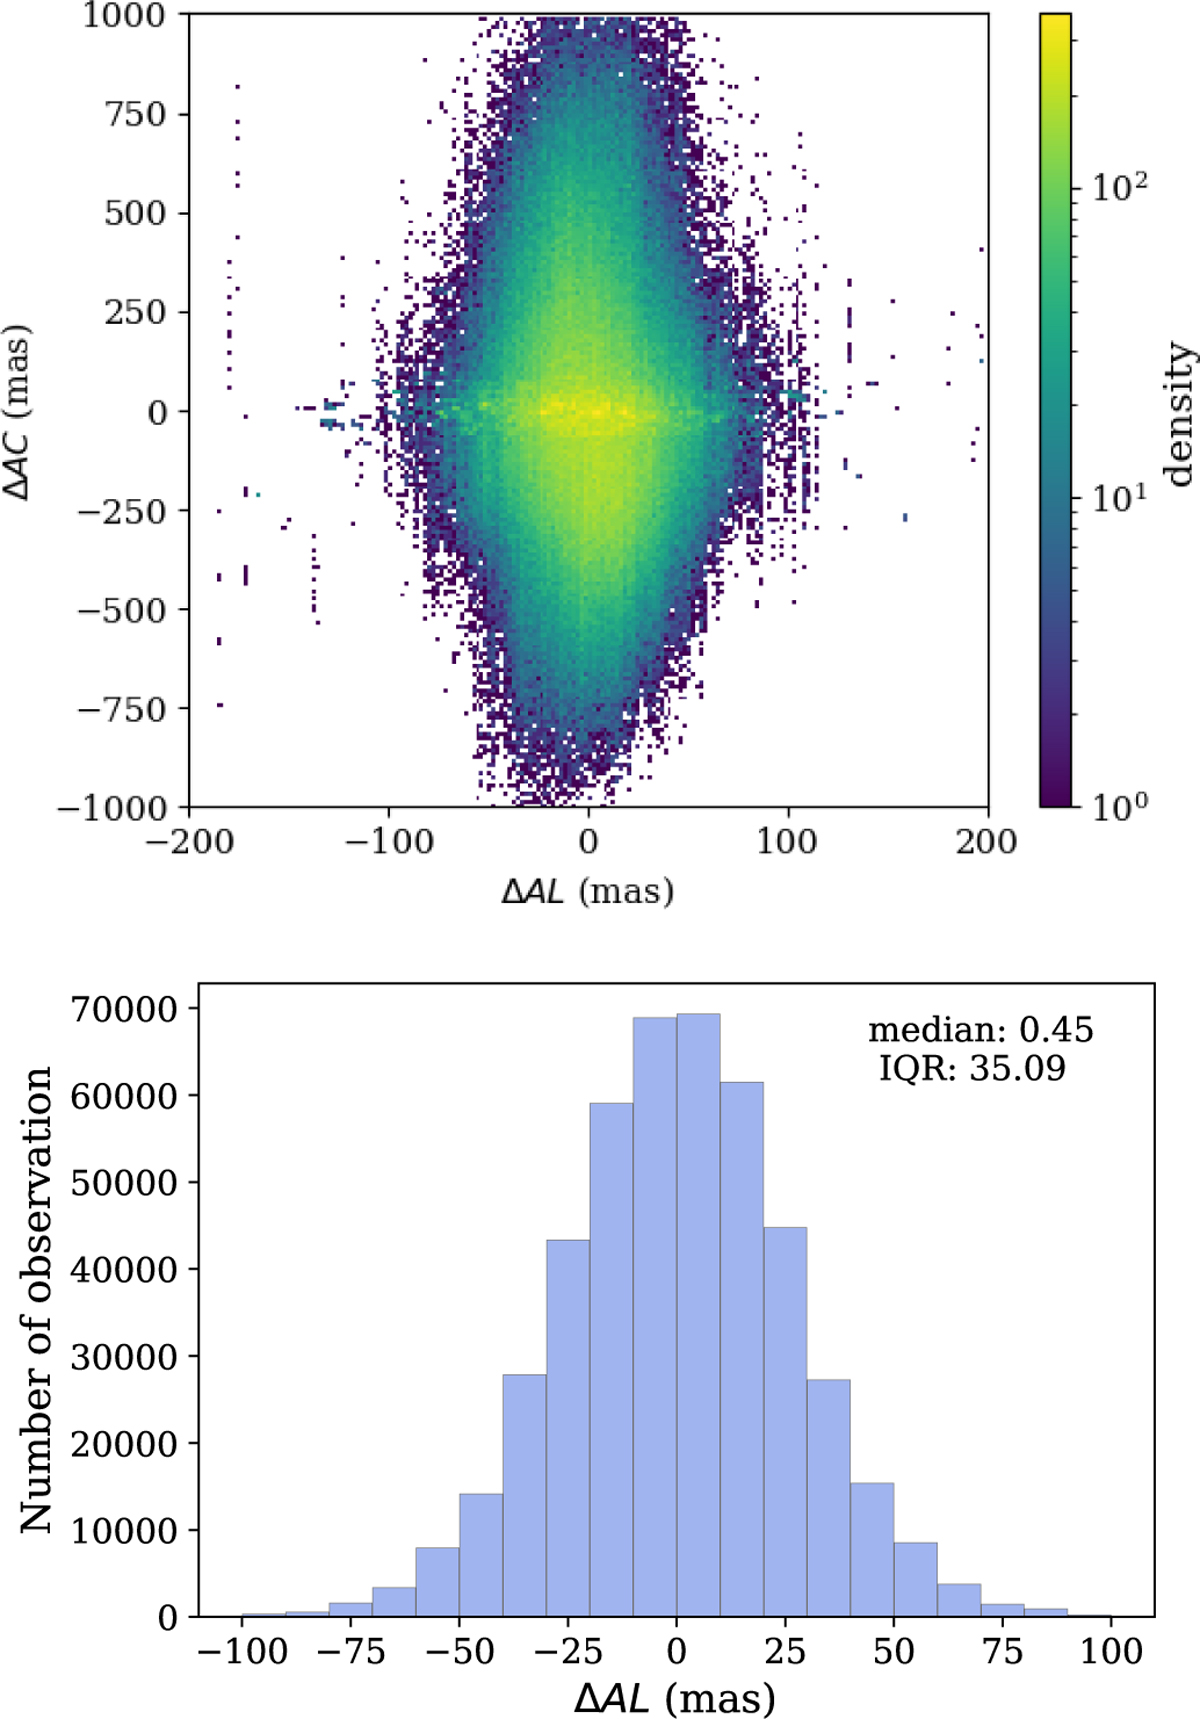
Distribution of positional differences between Gaia observations and ephemerides in the AL, AC plane for G1315. The frequency distribution along the AL axis is reproduced in the bottom panel.
Current usage metrics show cumulative count of Article Views (full-text article views including HTML views, PDF and ePub downloads, according to the available data) and Abstracts Views on Vision4Press platform.
Data correspond to usage on the plateform after 2015. The current usage metrics is available 48-96 hours after online publication and is updated daily on week days.
Initial download of the metrics may take a while.