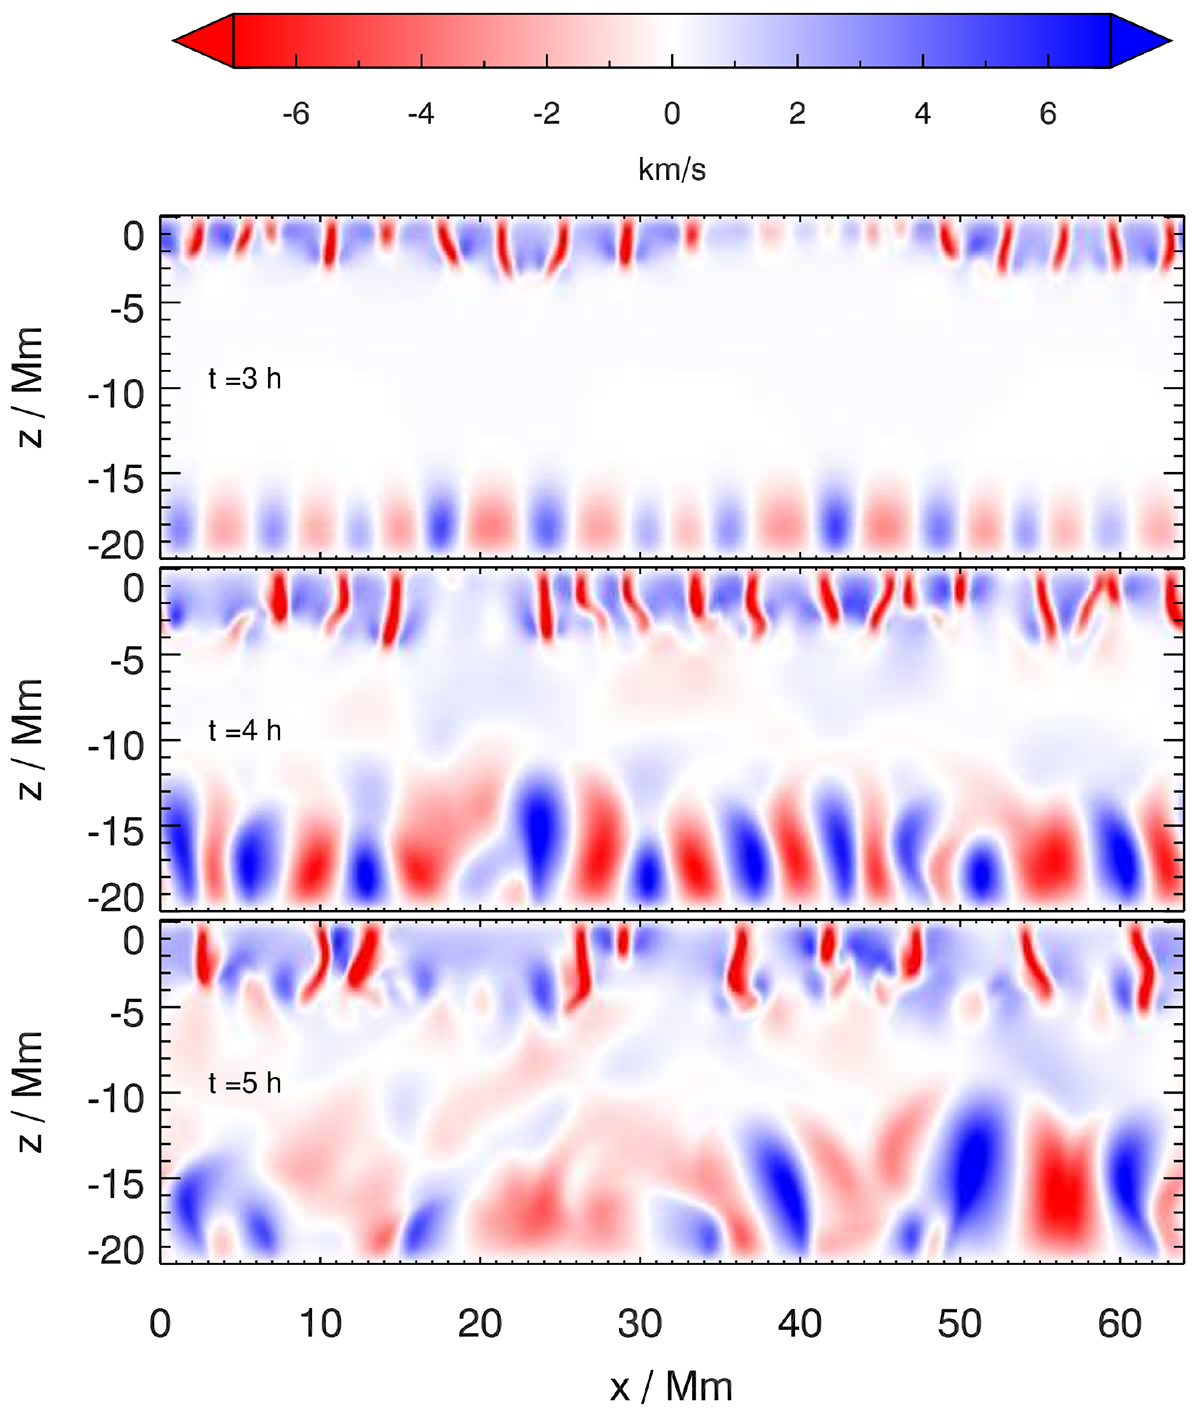
Fig. 2.
Download original image
Snapshots of the reference run at three different times. The top panel shows the run at the time when the surface is completely covered by granules. Convection at the bottom also develops, although there is still a region without significant convection between the two regions. The middle panel shows the same run one hour later, when the convection in both regions started to connect. The bottom panel shows the state of the simulation after the simulation advanced by another hour. The convection from below starts to destroy the surface granulation. Red shows a downward motion, and blue shows an upward motion. The color is saturated at ±7 km/s.
Current usage metrics show cumulative count of Article Views (full-text article views including HTML views, PDF and ePub downloads, according to the available data) and Abstracts Views on Vision4Press platform.
Data correspond to usage on the plateform after 2015. The current usage metrics is available 48-96 hours after online publication and is updated daily on week days.
Initial download of the metrics may take a while.