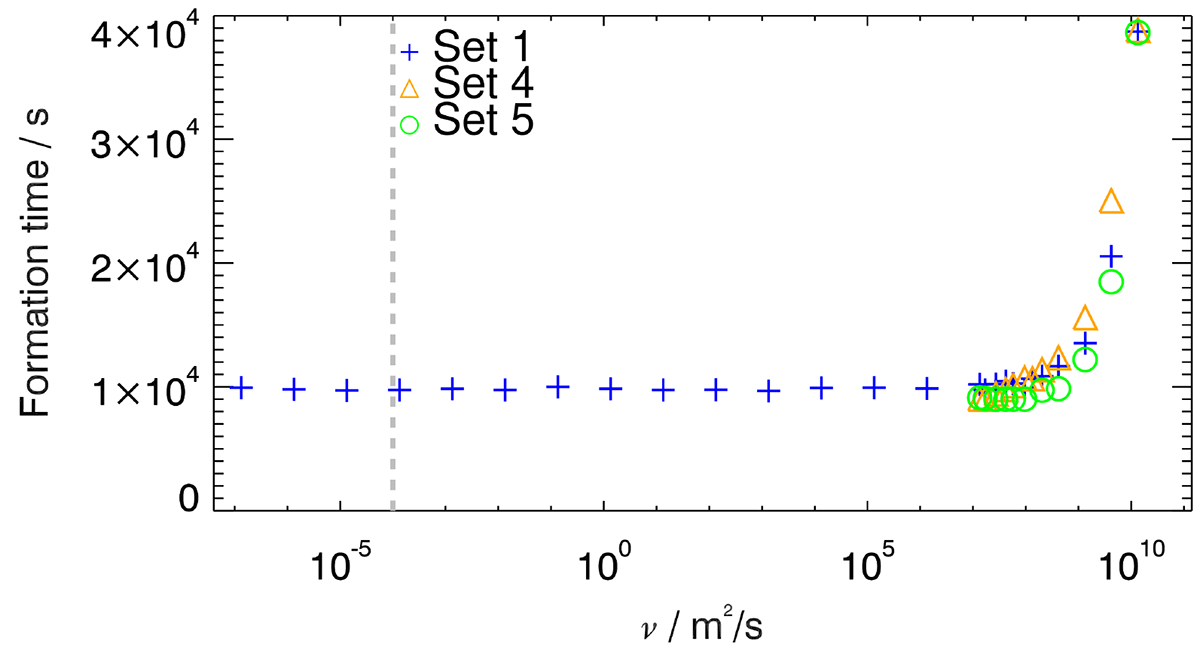
Fig. 4.
Download original image
Same plot as Fig. 3, but for sets 1, 4, and 5. Sets 4 and 5 do not develop convection below ν = 1.34 ⋅ 107 m2/s. Set 4 shows shorter formation times for runs when the scaled shock viscosity is below the value for the reference run and longer formation times for runs with a higher shock viscosity than the reference run. Set 5 shows generally shorter formation times, except for the run with the highest viscosity.
Current usage metrics show cumulative count of Article Views (full-text article views including HTML views, PDF and ePub downloads, according to the available data) and Abstracts Views on Vision4Press platform.
Data correspond to usage on the plateform after 2015. The current usage metrics is available 48-96 hours after online publication and is updated daily on week days.
Initial download of the metrics may take a while.