Fig. 10
Download original image
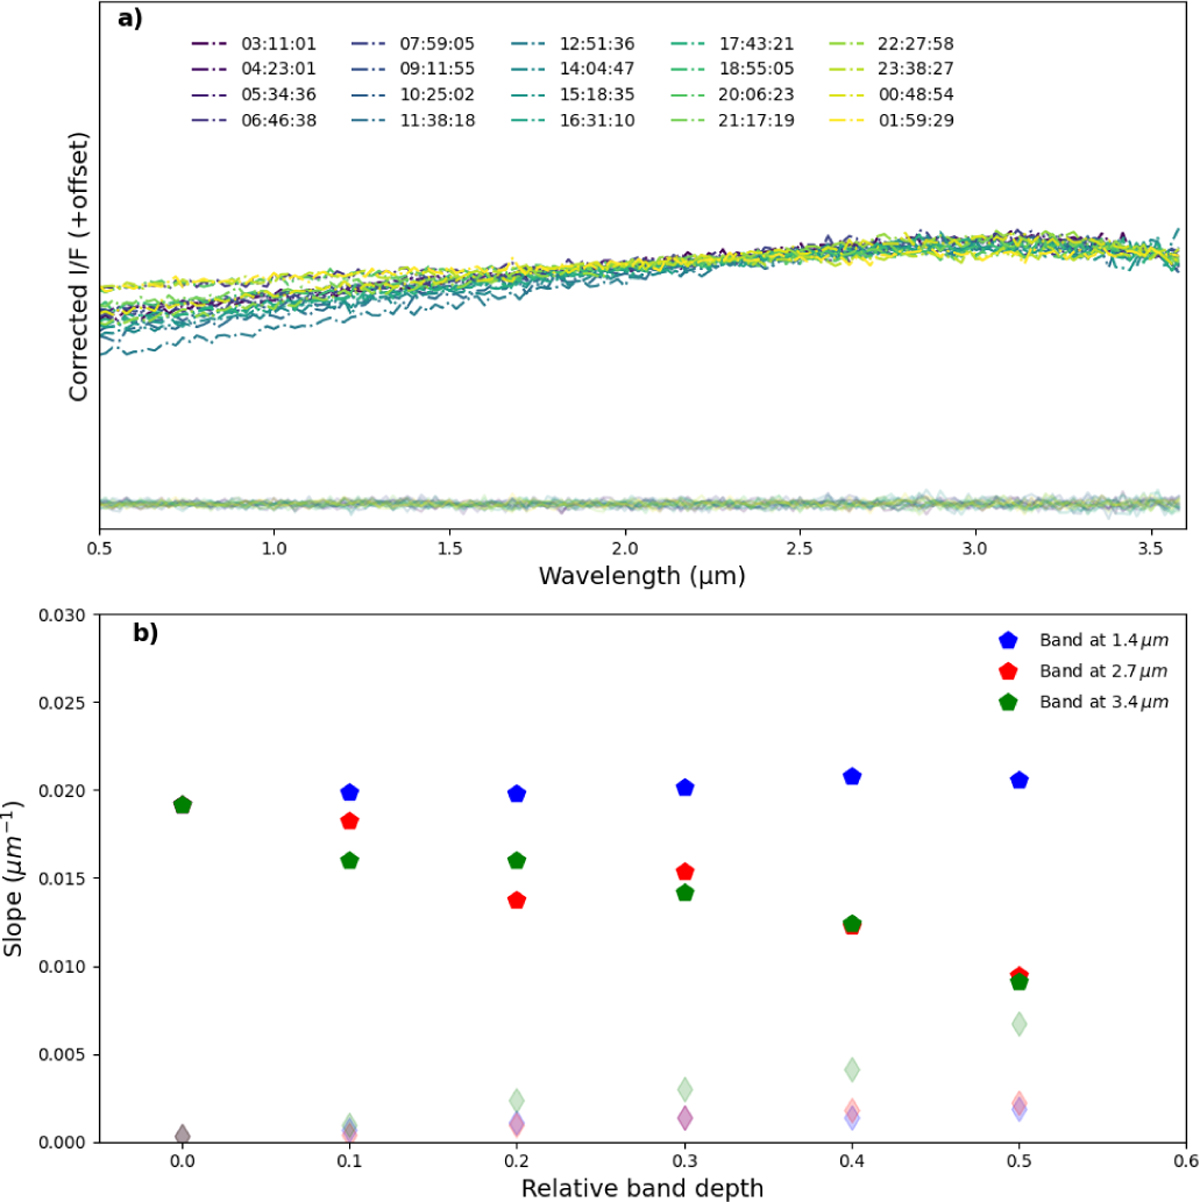
(Panel a) Residual spectra (with offsets) after correction with our method (plain transparent), and the iterative black-body fitting from David et al. (2024) (dash-dotted lines). The synthetic data used for the comparison are the same as that presented in Fig. 7 earlier. (Panel b) Evolution of the slope residual with the presence of an absorption band in the spectra.
Current usage metrics show cumulative count of Article Views (full-text article views including HTML views, PDF and ePub downloads, according to the available data) and Abstracts Views on Vision4Press platform.
Data correspond to usage on the plateform after 2015. The current usage metrics is available 48-96 hours after online publication and is updated daily on week days.
Initial download of the metrics may take a while.