Fig. 3
Download original image
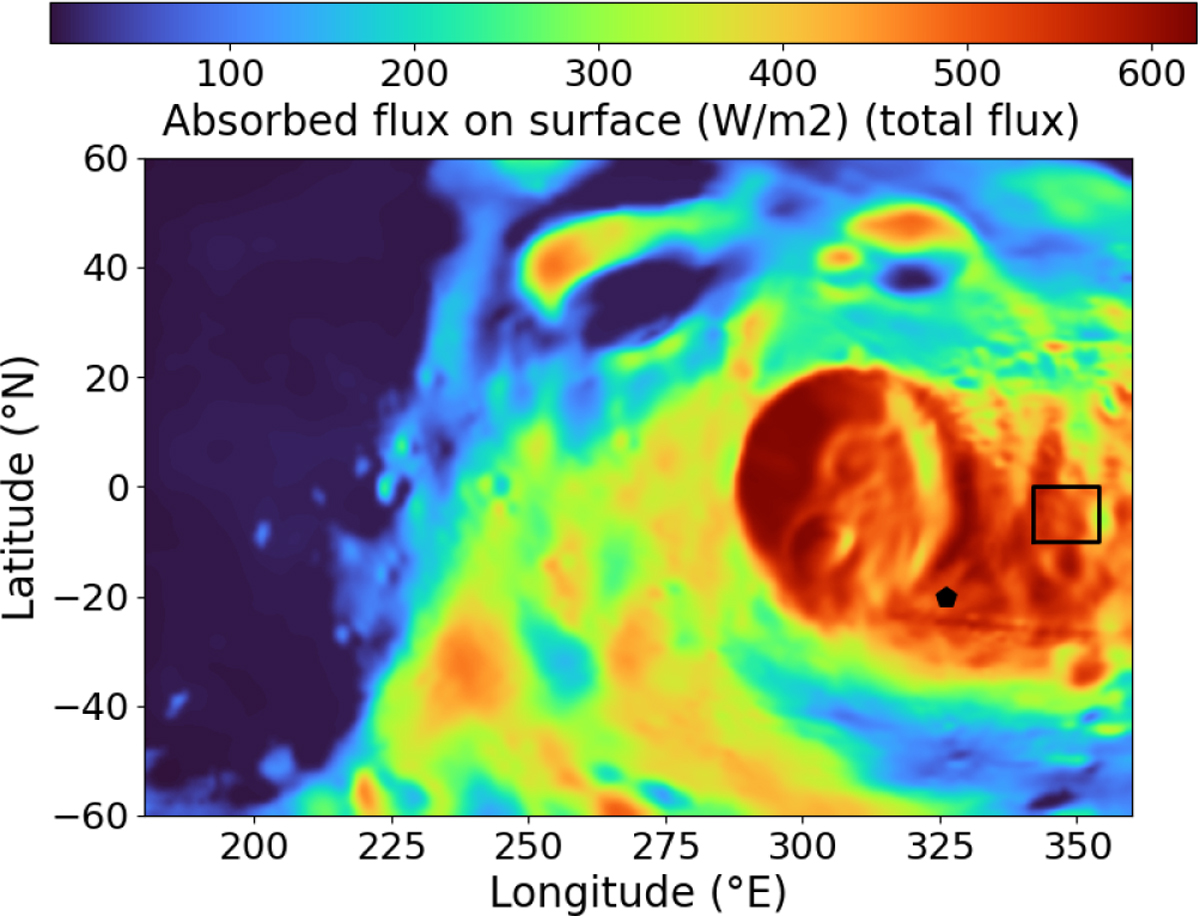
Simulation of the fluxes absorbed by the surface of Phobos on October 23, 2007. Stickney is the large crater on the right (310°E). This simulation shows the total absorbed flux on Phobos (direct and reflected solar flux, Mars thermal emission and self-illumination). The rectangle in black is the region of interest (RoI) where we plotted the absorbed flux over the complete revolution in Fig. 4. The black pentagon represents the position of the sub-solar point at the time of the simulation.
Current usage metrics show cumulative count of Article Views (full-text article views including HTML views, PDF and ePub downloads, according to the available data) and Abstracts Views on Vision4Press platform.
Data correspond to usage on the plateform after 2015. The current usage metrics is available 48-96 hours after online publication and is updated daily on week days.
Initial download of the metrics may take a while.