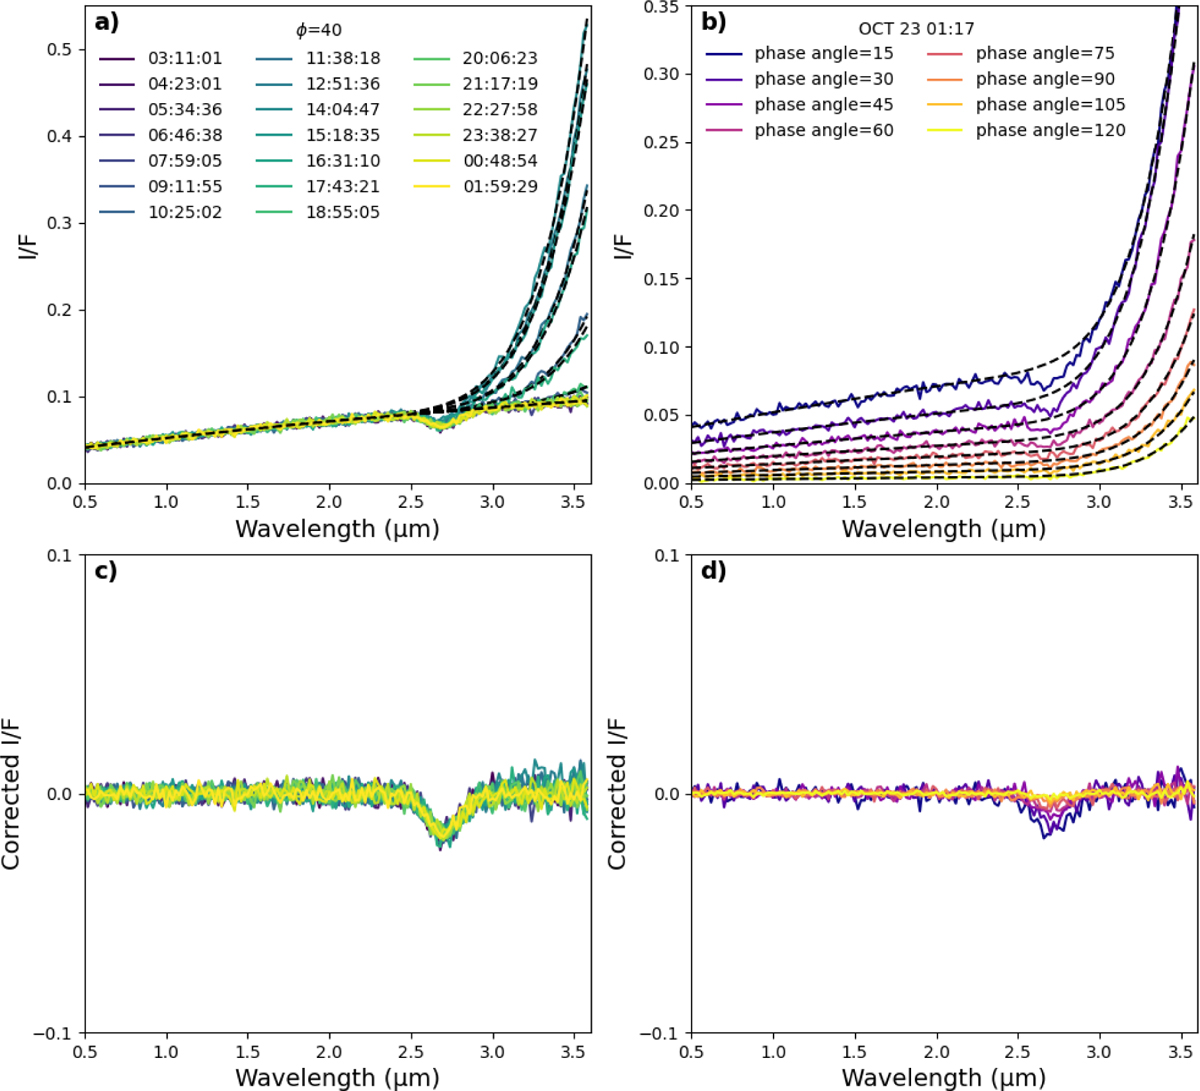
Fig. 8
Download original image
Synthetic data created with our model following the protocol in Section 3.1 for (a) 20 different local times and (b) eight different geometries of observation, varying the phase angle ϕ, with the fitted spectrum for the correction. Panels (c) and (d) show respectively the residual spectra after removing the fitted thermal emission and the assumed reflected component with an artificial absorption band.
Current usage metrics show cumulative count of Article Views (full-text article views including HTML views, PDF and ePub downloads, according to the available data) and Abstracts Views on Vision4Press platform.
Data correspond to usage on the plateform after 2015. The current usage metrics is available 48-96 hours after online publication and is updated daily on week days.
Initial download of the metrics may take a while.