Open Access
Fig. 9
Download original image
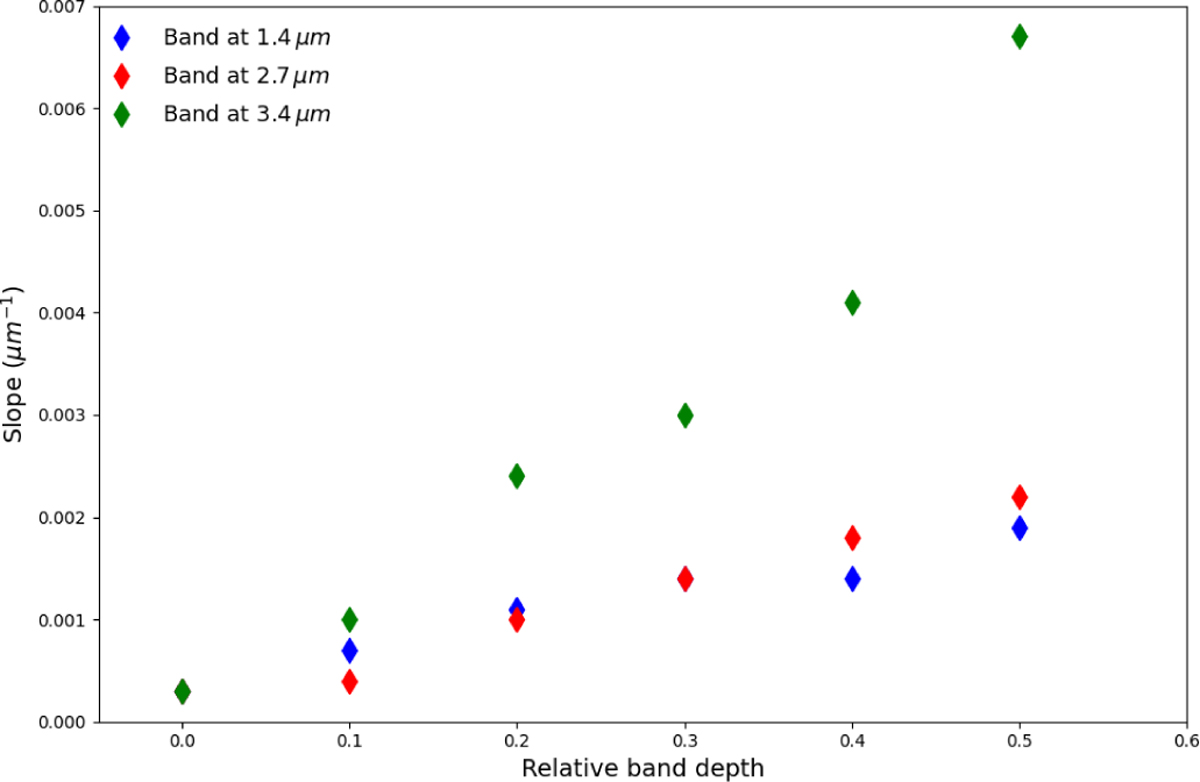
Slope of the corrected spectra. The slope increases with the relative band depth. The location of the band also strongly changes the quality of the correction and, as expected, a band in the range 3–3.5 μm region has a strong impact on the correction.
Current usage metrics show cumulative count of Article Views (full-text article views including HTML views, PDF and ePub downloads, according to the available data) and Abstracts Views on Vision4Press platform.
Data correspond to usage on the plateform after 2015. The current usage metrics is available 48-96 hours after online publication and is updated daily on week days.
Initial download of the metrics may take a while.