Fig. 1
Download original image
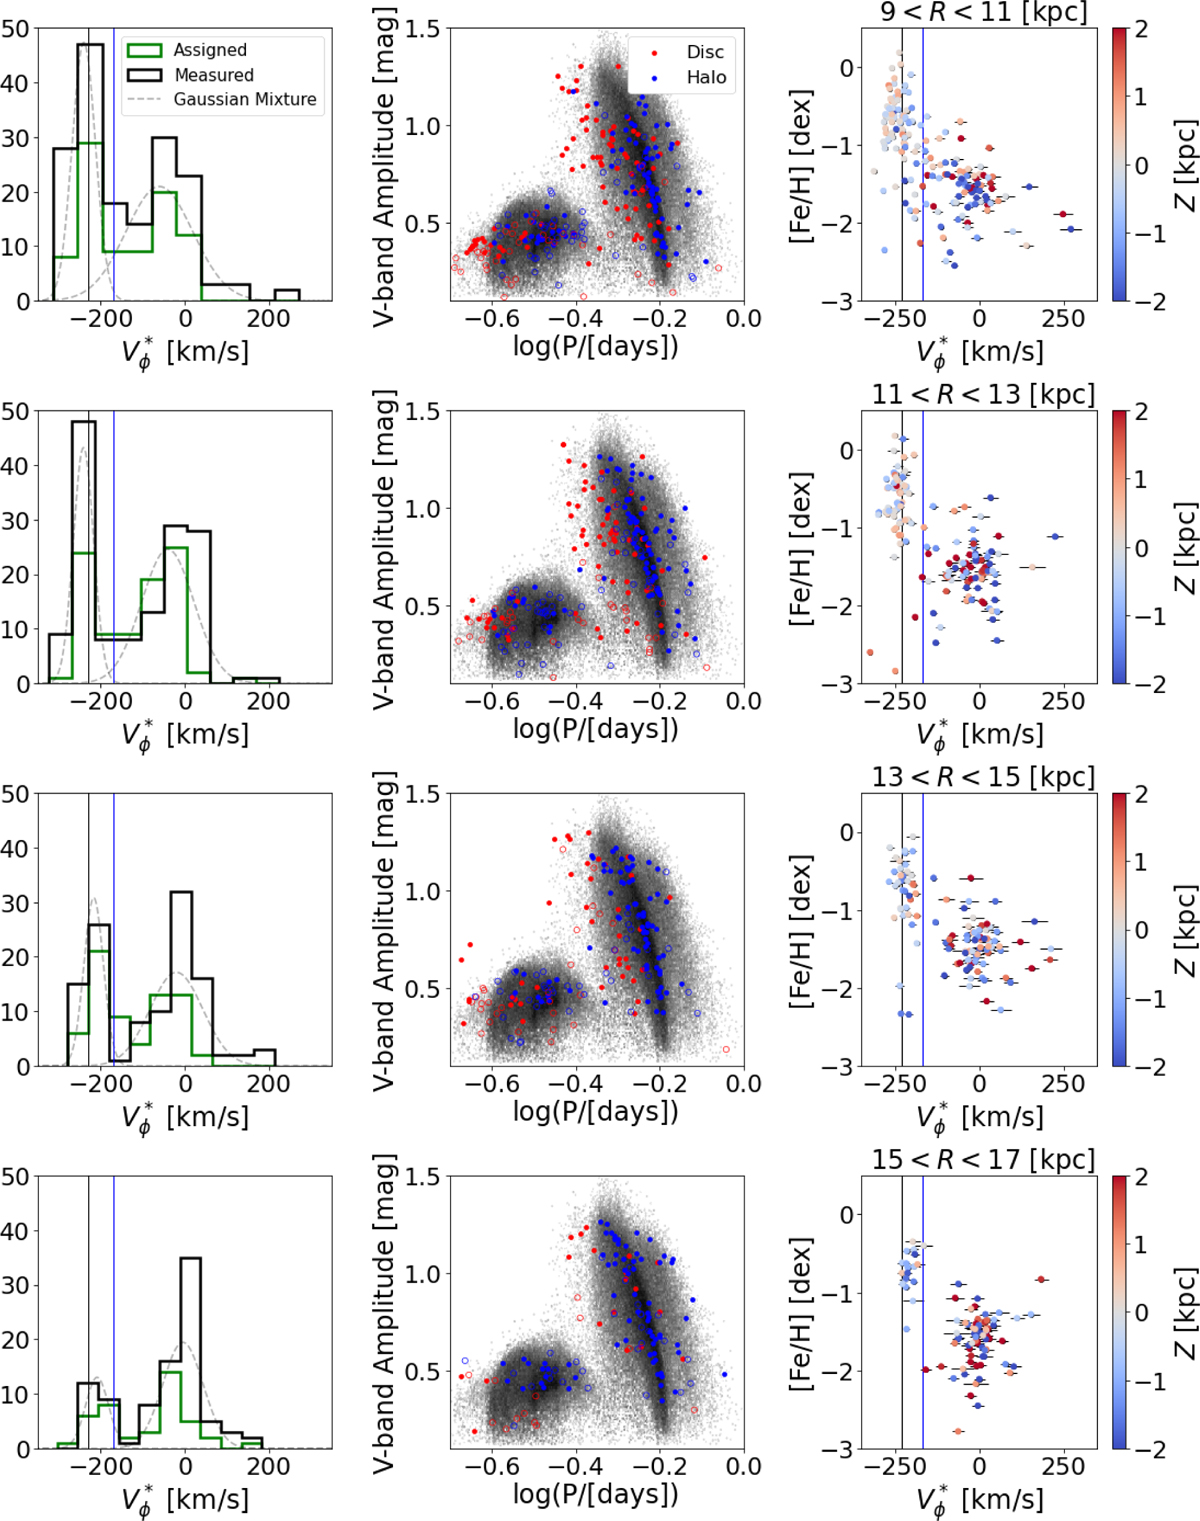
Bimodality of the population of RRLs in velocity and metallicity. The first column shows the histogram of Vϕ* for the RRLs with measured (Li et al. 2023b) photometric metallicity (black) and those with assigned metallicities (green, see Sect. 2); the Gaussian mixture for the total sample solution is shown for illustration (dotted grey line). The second column shows the period-amplitude (V-band) diagram where red dots are fast rotating RRLs with Vϕ* < −170 km s−1 and blue dots are slower rotating RRLs with Vϕ* > −170 km s−1. The third column shows the Vϕ*, [Fe/H] plane for the RRLs with measured metallicities, with the black and blue vertical lines indicating Vϕ* = −230 km s−1 and Vϕ* = −170 km s−1, respectively for all panels. From top to bottom, each row corresponds to a different radial bin: R ∈ (9,11), (11,13), (13,15), (15,17) kpc.
Current usage metrics show cumulative count of Article Views (full-text article views including HTML views, PDF and ePub downloads, according to the available data) and Abstracts Views on Vision4Press platform.
Data correspond to usage on the plateform after 2015. The current usage metrics is available 48-96 hours after online publication and is updated daily on week days.
Initial download of the metrics may take a while.