| Issue |
A&A
Volume 701, September 2025
|
|
|---|---|---|
| Article Number | A136 | |
| Number of page(s) | 10 | |
| Section | Galactic structure, stellar clusters and populations | |
| DOI | https://doi.org/10.1051/0004-6361/202452736 | |
| Published online | 09 September 2025 | |
RR Lyrae stars trace the Milky Way warp
1
Departamento de Astronomía, Instituto de Física, Universidad de la República,
Iguá 4225,
CP 11400
Montevideo,
Uruguay
2
National Astronomical Observatory of Japan,
Mitaka-shi,
Tokyo
181-8588,
Japan
★ Corresponding author: This email address is being protected from spambots. You need JavaScript enabled to view it.
Received:
24
October
2024
Accepted:
22
July
2025
Abstract
Context. The outskirts of the Milky Way disc have been known to be warped since the late 1950s. Although various stellar populations have shown an underlying warped distribution, the relation between the age of the population and the warp they trace remains an open question. Understanding this relation may shed light on the origin of the warp, which remains a puzzle to be solved.
Aims. Our goal in this work is to detect the presence of the warp in the RR Lyrae (RRL) population of the Milky Way disc.
Methods. We used a compilation of the three largest public catalogues of RRL stars, precise photometric distances (∼5%), and Gaia DR3 proper motions to kinematically select a sample of thin disc RRLs in the Galactic anti-centre, where the tangential velocity best approximates the azimuthal velocity to differentiate between those that rotate (disc) and those that do not (halo). For disc-like RRLs (321), we analysed their mean vertical height and mean vertical velocity.
Results. For the first time, we show that RRL stars with thin disc-like kinematics trace the warp. In the anti-centre direction, the RRL population reaches a minimum in mean vertical height of ≈0.4 ± 0.2 kpc, with a trend systematically lower than the one found with classical Cepheids. The kinematical signal of the RRL warp starts at R ≈ 10 kpc and, rather than resembling that of the Cepheids, shows a similar trend to the red clump population from previous works, reaching a maximum value of ≈9 ± 5 km s−1 in vertical velocity. We also obtain an estimation of the pattern speed of the RRL warp with a prograde rotation of ≈13 ± 2 km s−1 kpc−1, which is compatible with results obtained from classical Cepheids. Finally, we also obtain a vertical velocity dispersion ≈17 km s−1, which is inconsistent with the kinematics of a canonical old age (>10 Gyr) disc population and, instead, favours a population dominated by intermediate age stars (3–4 Gyr), in agreement with recent works that suggest the existence of such unexpected intermediate age RRLs in the thin disc.
Conclusions. Our results indicate that thin disc RRL stars are a dynamical intermediate-age tracer of the warp, which opens a new window to study the dependency of the warp on stellar age in the Milky Way. The warp’s age dependency will help constrain the physical mechanism behind its origin and its role in the Milky Way dynamical history.
Key words: stars: variables: RR Lyrae / Galaxy: disk / Galaxy: kinematics and dynamics / Galaxy: structure
© The Authors 2025
 Open Access article, published by EDP Sciences, under the terms of the Creative Commons Attribution License (https://creativecommons.org/licenses/by/4.0), which permits unrestricted use, distribution, and reproduction in any medium, provided the original work is properly cited.
This article is published in open access under the Subscribe to Open model. This email address is being protected from spambots. You need JavaScript enabled to view it. to support open access publication.
1 Introduction
For a long time, we have known that the Milky Way disc is warped (Burke 1957). However, its origin and role in the history of the Galaxy is still unknown. Various formation mechanisms have been proposed for the formation of the warp: gravitational interaction with the halo (Sparke 1984; Ideta et al. 2000; Jeon et al. 2009; Han et al. 2023), interaction with external galaxies (Chequers et al. 2018; Semczuk et al. 2020; Bland-Hawthorn & Tepper-García 2021; Poggio et al. 2021), and gas accretion (Roškar et al. 2010). Each mechanism has consequences on the observational side. For gas accretion, it is expected that mostly the young population traces the warp while the older one, which did not form in the accreted gas, does not. In the case of gravitational interaction, it is expected that all populations trace a similar warp, although the effect on each population may depend on its initial conditions, such as velocity dispersion, and therefore its age. For these reasons, one way to restrict the warp’s origin is by studying populations of different ages.
In the Milky Way, different disc tracers have shown features in their positions and/or kinematics typical of a warped disc. For example, young stellar populations like pulsars (Yusifov 2004), classical Cepheids (Chen et al. 2019; Skowron et al. 2019; Dehnen et al. 2023; Cabrera-Gadea et al. 2024), OB stars (Romero-Gómez et al. 2019; Li et al. 2023a), stellar populations with a mean intermediate age, such as red clump stars (López-Corredoira et al. 2002; Gaia Collaboration 2021; Uppal et al. 2024), red giant branch stars (Romero-Gómez et al. 2019; Gaia Collaboration 2023), K-type stars (Cheng et al. 2020), A-type stars (Ardèvol et al. 2023) and even mixed stellar populations (Amôres et al. 2017; Chrobáková et al. 2020; Jónsson & McMillan 2024) have been shown to trace a warped disc. The relationship between the warp’s shape and the age of the tracer, however, is still unclear. Some works have found the amplitude of the warp increases for older stellar populations (Amôres et al. 2017; Romero-Gómez et al. 2019; Uppal et al. 2024) while others claim the opposite (Cheng et al. 2020; Chrobáková et al. 2020; Wang et al. 2020; Li et al. 2023a). It has also been noted that, within the uncertainty in each model of the warp, most of the works are roughly in agreement (see Sect. 5.1.1 Cabrera-Gadea et al. 2024). The differences and contradictions in the literature may arise from several factors: from methodological differences, the purity of the samples, their selection function, and the uncertainties in estimating distances in the outer regions of the disc where the warp is present. Each work takes a different approach on how to determine the warp geometry (stars counts, modelling of the vertical velocity as a function of the radius, and modelling or direct measurement of the mean vertical height), often with different assumptions on the kinematics of the warp, its symmetry, the absence or not of a twist of the line of nodes, and/or a particular radial dependency of the warp. The extinction in the disc affects the detection of stars close to the Galactic plane, and hence the selection function which, unaccounted for, can lead to an overestimation of the amplitude of the warp (see Appendix B in Cabrera-Gadea et al. 2024). Purity can affect the reliability of the age determination, and the accuracy and precision in the distance determination, which are often difficult to achieve at the large distances of the outer disc, are key to study the global warp structure and kinematics.
Standard candles offer the best performance in determining distance and, generally, ensure the purity of the sample. Classical Cepheids have been widely used to study the warp because of their excellent distance precision (~3%), wide disc coverage, and, since they are all younger than 500 Myr, the fact that they act as tracers of the gaseous disc in which they formed. Thus, Cepheids have proved to be of great use in characterising the warp’s structure and kinematics (Chen et al. 2019; Skowron et al. 2019; Dehnen et al. 2023; Cabrera-Gadea et al. 2024) but they do not help us understand the changes with stellar age. To do that, we would need an alternative standard candle representative of the dynamics of the older stellar component of the thin disc (TnD). To the best of our knowledge, the only previous study that looks for the warp with standard candles older than the Cepheids is Iwanek et al. (2023), where Mira stars were used. However, as pointed out by the authors, the presence or absence of the warp could not be determined with their sample due to its incompleteness.
RR Lyrae stars (RRLs) are a popular standard candle for the oldest stellar populations (>10 Gyr) and have been widely used as tracers of the thick disc (Layden 1995; Kinemuchi et al. 2006; Mateu & Vivas 2018). Given its short radial scale length (hR = 2.1 kpc, Mateu & Vivas 2018), it is not expected that the outermost region of the thick disc would trace the warp, since only ~2% of thick disc stars would be found at distances beyond the warp’s onset (R ≈ 10-12 kpc). However, evidence of the Solar neighbourhood for RRLs with TnD kinematics and metal-licity has been accumulating (Prudil et al. 2020; Zinn et al. 2020; Marsakov et al. 2019) and suggests that their [α/Fe] abundances are compatible with the TnD as well (Zinn et al. 2020). Iorio & Belokurov (2021) show that there is a fraction of RRLs with TnD kinematics beyond the Solar neighbourhood up to R ≈ 25 kpc, which raises the question of whether or not this population also traces the warped TnD. Either scenario would be of great interest to restrict the dynamical origin of the warp in the Galaxy.
RRL stars, such as the Cepheids, offer low distance uncertainties (~5%) and large spatial coverage, with the addition of being more numerous and having a well-understood selection function (Mateu 2024; Mateu et al. 2020). Contrary to the Cepheids, however, they are not unequivocal tracers of the TnD. RRLs trace almost all structures and sub-structures of the Milky Way, making it impossible to differentiate which structure they belong to just by virtue of being an RRL. This aspect, together with the lack of RRL catalogues with extended radial and azimuthal coverage at low latitudes, has until recently delayed the analysis of the warp, and indeed of the TnD beyond the solar neighborhood, using RRLs.
In this paper, we use the largest public catalogues of RRLs to date (Section 2) to detect the Galactic disc’s warp by selecting TnD samples based on metallicity and on rotation velocity (Section 3). In Section 4 we show that the TnD traced by the RRL has the signal of the warp imprinted in the mean Z and Vz as a function of the galactocentric radius, and we compare it to other results in the literature. Our conclusions are summarised in Sect. 5.
2 RR Lyrae sample
In this work, we used a catalogue containing 309 998 stars, compiled by combining the three largest public RRL surveys: Gaia Data Release 3 (DR3) Specific Objects Study (SOS, Clementini et al. 2023), ASAS-SN (Jayasinghe et al. 2019) and PanSTARRS1 (PS1, Sesar et al. 2017). We implemented the quality cuts and cross-matching strategy described in Sect. 2 of Mateu et al. (2020) for each catalogue, removed duplicates based on Gaia’s source_id, and restricted the final catalogue to stars with RUWE < 1.4 to ensure the quality of the astrometric parameters, as recommended by Lindegren, L. et al. (2021).
Distances to the RRL stars were computed via the MG -[Fe/H] relation from Garofalo et al. (2022) using photometric metallicities recalculated by Li et al. (2023b) for Gaia DR3 RRL. For stars without a photometric metallicity estimate, we assigned a metallicity from a normal distribution with mean −0.65 dex and standard deviation 0.28 dex1. As for their uncertainties, we assigned them a fixed value of 0.3 dex, which is the mean error from the measured metallicity. This assumption affects the star’s distance and, by extension, its inferred velocity, as we discuss in Sect. 3. For the G-band apparent mean magnitude, we used phot_g_mean_mag and extinctions were calculated using the Green et al. (2019) 3D extinction map. The extinction law coefficient for the Gaia G band was taken from Eq. A1 of Ramos et al. (2020), assuming BP - RP = 0.7 for all RRLs and an RV = 3.1. This assumption is well justified by the fact that RRLs span a limited range of colours, as a consequence of the narrow extent of the instability strip in temperature. Using only G-band photometry under this assumption circumvents the need to limit the sample to the RRLs with reliable measurements of BP (blue photometer) and RP (red photometer) (which would reduce the sample to almost half). The systematic colour difference between RRab and RRc stars is at most 0.15 in BP-RP, which would translate into a difference of <0.04 in extinction and 1.8% in distance, which is why it can safely be ignored when compared to the total error budget.
3 Kinematic selection of TnD RRL in the anticentre
The Galactocentric reference frame and cylindrical coordinate system (R, ϕ, z) used throughout this work is the same that as presented in Cabrera-Gadea et al. (2024), with only a slight difference in the solar Galactocentric cartesian velocity, taken here as (Vx, Vy, Vz) = (11.10,248.5,7.25) km s−1 (Schönrich et al. 2010; Reid & Brunthaler 2020). In this frame, negative Vϕ corresponds to prograde disc rotation.
We focus our analysis on the anticentre where the azimuthal velocity, Vϕ*, calculated solely from the proper motions, i.e. without a line of sight velocity, best approximates the full azimuthal velocity, Vϕ (Gaia Collaboration 2021; McMillan et al. 2022). The anticentre sample was selected as all RRLs with 165° < ϕ < 195°, 9.5 < R/kpc < 17, |Z| < 3 kpc, ∣V*z∣ < 70 km s−1, and error in Vz* and Vϕ* < 40 km s−1. The cuts in Z and Vz* remove clear outliers and ensure our sample consists only of disc-like RRLs. Finally, after visual inspection of all the light curves, we rejected 16 RRLs as misclassified (see Table A.1 and details in Appendix A).
In Fig. 1, the first column shows histograms for Vϕ* for the anticentre sample. The black and green lines show the histograms for the sample with measured and assigned photometric metallicities (see Sect. 2), respectively. A bimodality is clear in both: a fast component (Vϕ* < −170 km s−1) rotating like the bulk disc population, containing 321 RRL, and a slower or almost non-rotating component (Vϕ* > −170 km s−1), corresponding to the halo. Therefore, we define our sample of kinematically selected TnD RRL stars as those with Vϕ* < −170 km s−1. We used a Gaussian mixture decomposition to find that two is the optimum number of components (from a BIC test, Ivezic´ et al. 2014b) to describe the Vϕ* histogram (both Gaussians are shown in grey for each bin). Also, because both Gaussians intersect close to 170 km s−1 at all radii, we selected this as the threshold to differentiate between both populations. For the final TnD sample, the mean is Vϕ* ≈ 230 km s−1, as expected for the thin disc (Ablimit et al. 2020; Sun et al. 2024). The final disc anticentre sample is summarised in Table 1.
As previously mentioned in Sect. 2, our assumption on disc metallicity for those stars without photometric-metallicity measurements affects the distance and, by extension, the velocity. If a halo star is (wrongly) assigned a disc metallicity, its distance will be underestimated, and its proper motion will translate into a slower velocity. Because we are selecting disc stars as the ones that rotate faster, it is unlikely this assumption will introduce halo contaminants into our disc sample.
Since we do not have photometric metallicities for all the RRLs in our sample, we used the period-amplitude diagram to check whether our full kinematic-selected sample is consistent with what is expected for a more metal-rich population compared to the more metal-poor halo. This is shown in the second column of Fig. 1 for different radial bins. The full and empty dots show whether the RRL has a photometric or assigned metallic-ity, respectively. The RRLs with Vϕ* < −170 km s−1 (full and empty red dots) have a shorter mean period than those with Vϕ* > −170 km s−1. This difference is indicative of a higher metallicity in the rotating component, and it is also clear in comparison to the full catalogue (grey), which is dominated by the metal-poor halo population.
Finally, for those RRLs with photometric metallicities, the third column in Fig. 1 shows the (Vϕ*, [Fe/H]) plane colour-coded by vertical height. The bimodality in Vϕ* also corresponds to a bimodality in metallicity, which is clearer in the outermost radial bins (R > 11 kpc) where the TnD dominates and the thick disc is no longer present due to its shorter scale length. In the 9 < R < 11 kpc bin, the transition between the two separate populations (halo and TnD) seems, unsurprisingly, to be bridged by thick disc RRLs. As we move to the outer disc, it is clear that the fast-rotating and metal-rich population is always close to the Galactic plane (|Z| < 2) kpc and the mean tends to go below the Galactic plane (as observed for the warped TnD traced by Cepheids; Cabrera-Gadea et al. 2024). The median of the photometric metallicity of the RRLs with Vϕ* < −170 km s−1 is ≈ - 0.65 dex, as expected for the thin disc population (Hawkins 2023)
Therefore, the selected sample of RRLs in the anticentre direction by Vϕ* < −170 km s−1 is remarkably consistent with what is expected in kinematics (mean Vϕ* ≈ 240 km s−1 and  km s−1 Sanders & Das 2018; Sun et al. 2024), metallic-ity, and height distribution for the Galactic TnD population (e.g. Das et al. 2024).
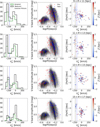 |
Fig. 1 Bimodality of the population of RRLs in velocity and metallicity. The first column shows the histogram of Vϕ* for the RRLs with measured (Li et al. 2023b) photometric metallicity (black) and those with assigned metallicities (green, see Sect. 2); the Gaussian mixture for the total sample solution is shown for illustration (dotted grey line). The second column shows the period-amplitude (V-band) diagram where red dots are fast rotating RRLs with Vϕ* < −170 km s−1 and blue dots are slower rotating RRLs with Vϕ* > −170 km s−1. The third column shows the Vϕ*, [Fe/H] plane for the RRLs with measured metallicities, with the black and blue vertical lines indicating Vϕ* = −230 km s−1 and Vϕ* = −170 km s−1, respectively for all panels. From top to bottom, each row corresponds to a different radial bin: R ∈ (9,11), (11,13), (13,15), (15,17) kpc. |
Anticentre sample of kinematically selected thin disc RRL stars.
4 Results and discussion
4.1 The warp traced across the disc
The last column of plots in Fig. 1 show that RRLs with [Fe/H] > −1 are dominated by the disc population. By selecting stars based on metallicity without filtering by Vϕ*, we can distinguish between the halo and disc populations across all azimuths, without being limited to the anticentre. For this particular sample, Fig. 2 presents a map of the mean Z (on the left) and Vz (on the right), obtained by a single component Gaussian extreme deconvolution (Vanderplas et al. 2012; Ivezic´ et al. 2014a) in each bin.
Figure 2 (left) shows the underlying warped distribution of the disc RRL population. Since selection effects due to extinction and crowding mostly affect the completeness of RRLs for X > 0, our sample mostly trace the warp at X < 0. We also explored the halo population ([Fe∕H]< −1) and it does not show any asymmetries (not shown), which supports the conclusion that the observed trend is likely to not be an artefact. The sign and coherent pattern, which is similar to the one traced by classical Cepheids (Skowron et al. 2019; Chen et al. 2019; Dehnen et al. 2023; Cabrera-Gadea et al. 2024), clearly reveals the underlying warped distribution. In the right panel of Fig. 2, the warp’s signal appears with positive velocities in the anticentre region as expected from a population ascending towards the northern extreme of the warp. Therefore, we have found that the RRLs with TnD-like kinematics, and equivalently the most metal-rich RRLs, follow a warp across the whole disc, qualitatively similar to the Cepheid’s warp.
4.2 The warp in the anticentre
Using the anticentre sample, we searched for the warp signal up to R ≈ 17 kpc. Figure 3 shows the mean Z (top) and Vz* (bottom) as a function of radius: in both plots, the black lines correspond to the mean in 1 kpc radial bins, within the 5th and 95th percentiles of Vz*. The grey shaded area corresponds to the standard deviation of 300 bootstrap realisations of our TnD sample of RRLs. The mean Vϕ*, Z, and Vz* with the TnD sample used is shown in Fig. C.1 in Appendix C.
The top panel in Fig. 3 shows a deviation of mean Z from the Galactic midplane by ≈-0.4 kpc at R ≈ 15 kpc. Even though Z is more susceptible to bias due to the selection function and extinction effects than Vz* (Romero-Gómez et al. 2019; Cabrera-Gadea et al. 2024), based on the selection function for our RRL catalogue from Mateu (2024), we are confident the Z trend is robust (see Appendix B). We compare the RRLs to our results with Cepheids in Cabrera-Gadea et al. (2024) (blue curve) and the results for the Cepheids in the same region and method as the RRL (blue dashed curve). We found that the RRLs share a similar trend to Cepheids, going below the Galactic mid-plane, with the RRLs being systematically lower than the Cepheids by ≈0.2 kpc at R > 13 kpc. Even within the uncertainty (dominated by low number statistics in our sample of RRL), the Cepheid and RRL trends may coincide only marginally at best.
For Vz*, the kinematic signal starts at a shorter radius (R ≈ 10 kpc) than for the Cepheids, for which it begins at R ≈ 11 kpc (Chen et al. 2019; Dehnen et al. 2023; Cabrera-Gadea et al. 2024)2. The positive trend with the radius reaches a maximum of ≈9 km s−1, then declines to ≈-5 km s−1. As discussed in Cabrera-Gadea et al. (2024), this is a clear signal of the warp and similar trends have been found in other stellar populations (Cheng et al. 2020; Li et al. 2023a) with different amplitudes but similar in their ‘arch’ shape. The bulk disc population from Jónsson & McMillan (2024) (orange) and the result from Gaia Collaboration (2021) for red clump stars (RC, brown curve) and intermediate population (IP, green curve)3 are also shown.
The difference between the younger and older stellar population in the starting radius and the linear growth in the anticentre direction was observed by Gaia Collaboration (2021). Here, it is confirmed by two samples of standard candles with precise distances at different ages. In contrast, we do not observe significant differences between RRLs and the intermediate-age populations. For the RC, which can be compared against the RRL sample for a larger range of radii, both populations have a similar mean Vz* up to R ≈ 14 kpc. For R > 14 kpc, within our uncertainty, both populations are compatible with the same trend in Vz*. The bulk population from Jónsson & McMillan (2024) shows the same trend as the RRL up to R ≈ 14 kpc, and seems to start declining earlier in radius but at a lower rate.
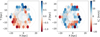 |
Fig. 2 Mean Z and Vz over the XY plane for the RRL sample with photometric metallicity [Fe/H] > −1. In each hexagonal bin, the mean Z (left) and Vz (right) computed by a Gaussian extreme deconvolution are plotted. The RRL sample with R > 8 kpc is plotted with transparent black dots. Dashed lines indicate galactocentric rings at R = 10 kpc, 15 kpc, and 20 kpc. |
 |
Fig. 3 Mean vertical height Z (top) and mean vertical velocity Vz* (bottom) as a function of the galactocentric radius, R, at the anticentre direction. We show our result for the sample of RRLs (black) and Cepheids best-fit warp at the anticentre from Cabrera-Gadea et al. (2024, blue solid line), and for the Cepheids, measured in the same region and with the same method as the RRLs (dashed blue line). The shaded areas correspond to one standard deviation from 300 bootstrap realisations. For Vz*, we add the bulk population from Jónsson & McMillan (2024) (BP, yellow curve) and the result from Gaia Collaboration (2021) for the red clump (RC, brown curve) and intermediate population (IP, green curve). |
Results from each radial bin for the anticentre sample of kinematically selected thin disc RRL stars.
4.3 The warp pattern speed
Inspired by our work in Cabrera-Gadea et al. (2024), where we show that the relative phases of Z and Vz are related to the time evolution of the warp, we found that Fig. 2 can give a general picture of the time evolution of the RRL warp. Because of the similarity with Cepheids in the relative phases between Z and Vz, i.e. positive Vz where Z goes from negative to positive in the stellar rotation direction, we can expect the change in amplitude to be negligible (A = 0) and the pattern speed (ω) to be slower than the angular velocity of the stars (Ω, see Eqs. (14) and (22) in Cabrera-Gadea et al. 2024). Under the assumption of A = 0 and a unique pattern speed, we developed a simple method to estimate the instantaneous pattern speed of the warp for our RRL sample (see Appendix D). The results are shown, as a function of the radius, in Fig. 4 for the RRLs (black curve) and Cepheids (blue, Cabrera-Gadea et al. 2024). The angular velocity (⟨Vϕ⟩/R) of the RRL is shown by the green curve. The RRL warp thus shows a prograde rotation with a mean pattern speed of ≈13 ± 2 km s−1 kpc−1for R > 12 kpc.
The pattern speed estimated for the RRLs is similar in magnitude and direction to that of the Cepheids (Dehnen et al. 2023; Cabrera-Gadea et al. 2024), which is also similar to the results of Poggio et al. (2020), Cheng et al. (2020), He (2023), Jónsson & McMillan (2024) and Poggio et al. (2025) with other disc tracers. It also shows the differential rotation present in the Cepheids (Dehnen et al. 2023; Cabrera-Gadea et al. 2024; Poggio et al. 2025) and young giants (Poggio et al. 2025), but due to our low number statistics, this trend should be taken with caution. Finally, in Table 2 we summarise all the results shown in this section, the mean Z, Vz, the pattern speed, the mean -Vϕ in each radial bin, and their corresponding uncertainties.
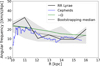 |
Fig. 4 Pattern speed as a function of radius for the RRLs’ warp (black curve), Cepheids’ warp (blue curve), and the angular velocity of the RRLs (green curve). The grey shaded area shows the 15% and 85% percentiles of the pattern speed results from the bootstrap realisation, the dashed line shows the median of the realisations. |
4.4 The age of the thin disc RR Lyrae
To use RRLs for the study of the warp’s age dependency, we need to assess whether our disc RRL sample is actually representative of an old population (>10 Gyr). Although RRLs are always assumed to be an old stellar population, for the TnD they have been proposed to be younger (5–7 Gyr) by Iorio & Belokurov (2021)4 based, under the assumption of an axisymmetric disc, on an analysis of their total velocity dispersion and the age-velocity-dispersion relation.
Here, we use the vertical velocity dispersion, σVz, as a proxy of stellar age (Anders et al. 2023, and references therein). By using σVz instead of the total velocity dispersion as in Iorio & Belokurov (2021), we do not assume the axisymmetry of the disc, which we have shown does not hold because of the warp. Figure 5 shows the σVz as a function of R, in the left panel comparing, for |Z| < 0.6 kpc, our TnD RRL sample (black curve) to the RC stars from Das et al. (2024) separated into stars with ages between 3–4 Gyr (green curve) and >9 Gyr (brown curve). The velocity dispersion of our TnD RRL sub-sample is inconsistent with the old population from Das et al. (2024), even within the uncertainties, and, instead, shows much better agreement with the intermediate-age population. Although our RRLs show colder kinematics for R > 13 kpc than the intermediate age, the inconsistency with the older population by Das et al. (2024) remains. We also compared the σVz from our RRL sample with results from Anders et al. (2023) in the same vertical and radial range. We found them to be consistent with an age close to 3-4 Gyr (σVz ≈ 15 km s−1) and also, within uncertainties, inconsistent with an age of >10 Gyr such as the canonically old RRL population.
The right panel of Fig. 5 shows the σVz of our total sample of TnD RRL (black), our sample of Cepheids (blue, Cabrera-Gadea et al. 2024), and the intermediate age population (IP) and RC from Gaia Collaboration (2021) in dashed green and red solid curves, respectively. Our TnD RRLs are consistent with the IP and RC populations in σVz at all radii. Given that an intermediate-age population dominates the RC (Girardi 2016), this adds evidence to the inconsistency of TnD RRLs with a canonically old population. We remark that the RRLs and the RC share the same mean vertical velocity and vertical velocity dispersion, which suggests that both experienced the same dynamic history.
 |
Fig. 5 Vertical velocity dispersion as a function of the galactocentric radius. Left: our results for the RRL (black curve) in the same vertical range as the result for 3-4 Gyr (dashed green curve) and >9 Gyr (red curve) by Das et al. (2024, D24). Right: vertical velocity dispersion for the total TnD RRL sample (black curve), for the Cepheids sample (blue dashed curve), for the red clump (red curve), and for the intermediate age population (green dashed curve) from Gaia Collaboration (2021) (GC21). |
5 Conclusions
For the first time, we show that RRL stars trace a warped thin disc. We used a compilation of the largest catalogues of Milky Way RRL stars (Gaia SOS, ASAS-SN-II, and PS1) and, using precise distances (∼5%) and proper motions from Gaia DR3, in the anticentre direction we find a clear kinematic separation between halo (Vϕ > −170 km s−1) and disc (Vϕ < −170 km s−1) RRLs. Our kinematic selection of TnD RRL stars has led us to the following conclusions:
Metal-rich RRL stars clearly exhibit the spatial and kinematic signal of the warp across the disc;
In the anticentre direction, the RRL warp in Z is systematically below the Cepheid’s warp by ≈0.2 kpc;
In the anticentre also, the RRL warp reaches similar vertical velocities, Vz* ≈ 7 km s−1, to the Cepheid’s warp but with a different radial profile. The vertical velocity of RRLs as a function of the radius is similar to the results for the intermediate-age population and RC stars by Gaia Collaboration (2021);
The pattern speed of the RRL warp is prograde with a mean value of 13 ± 2 km s−1 kpc−1 for R > 12 kpc, which is similar to previous results for the pattern speed for other stellar populations;
The vertical velocity dispersion for our kinematically selected RRLs is consistent with an intermediate age population of 3–4 Gyr. In contrast, we find that the expected velocity dispersion of a population with the ages typically associated with RRLs (>10 Gyr) is significantly higher, which supports a dynamical intermediate age for our sample of TnD RRL stars;
The vertical velocity of the RRL and the RC stars reported by Gaia Collaboration (2021) shows the same trend in their mean and dispersion, which reflects their similar dynamical history.
These results open a new window with which to analyse the Galactic disc’s warp. The addition of a new standard candle that traces the warp across the entire disc motivates its use to study wave phenomena in the TnD. Future works about the Milky Way warp’s origin will find the characterisations of Z and Vz needed to understand how this wave differs with the stellar population’s age in the RRL population. We leave an analysis on the Fourier decomposition of Z and Vz to enable a fair and more quantitative global comparison with the Cepheids’ population for future work.
Future work based on simulations will shed light on the use of different stellar populations to understand the nature of the origin of the warp and even to date its origin in each possible scenario. Although gas accretion could leave an age gradient in the amplitudes of the warp, in a gravitational scenario populations with different velocity dispersions may react differently at certain radii to gravitational disturbances, thus imprinting a different warp signal for each population. This might give a plausible clock to the origin of the warp. Further discussion is still needed in this regard.
Data availability
Full Tables 1 and 2 are available at the CDS via https://cdsarc.cds.unistra.fr/viz-bin/cat/J/A+A/701/A136.
Acknowledgements
MC and CM thank Adrian Price-Whelan, Eugene Vasiliev, Payel Das, Paul J. McMillan and Friederich Anders for useful discussions and are grateful for the hospitality and support of the CCA at Flatiron Institute where part of this research was carried out. The authors thank the referee M. Arifyanto for suggestions that improved the clarity of this work. This research has been supported by funding from project FCE_1_2021_1_167524 of the Fondo Clemente Estable, Agencia Nacional de Innovación e Investigación (ANII). This work has made use of data from the European Space Agency (ESA) mission Gaia (https://www.cosmos.esa.int/gaia), processed by the Gaia Data Processing and Analysis Consortium (DPAC, https://www.cosmos.esa.int/web/gaia/dpac/consortium). Funding for the DPAC has been provided by national institutions, in particular the institutions participating in the Gaia Multilateral Agreement. Software: Astropy (Astropy Collaboration 2018), AstroML (Vanderplas et al. 2012), Matplotlib (Hunter 2007), Numpy (Walt et al. 2011), Jupyter (Kluyver et al. 2016), TOPCAT (Taylor 2005, 2006) and PYGAIA (https://github.com/agabrown/PyGaia).
Appendix A Rejected stars
After visual inspection of the light curves of the kinematically-selected sample of TnD RRL stars in the anticentre (Sec. 3), there were 16 RRLs rejected as misclassified. These are summarised in Table A.1. The majority of rejected stars are eclipsing binaries, most of type EB (β Lyrae or semi-detached) that were misclassified as RRc stars in the Gaia DR3 SOS catalogue. We have indicated with P=2Psos when a true period twice of that reported by SOS produces a better light curve (with both eclipses clearly visible). In all of these cases, when available, the ratios between the G, BP and RP bands are close to unity, further supporting their classification as eclipsing binaries.
RRL stars rejected based on their light curves. Eclipsing binary types are denoted EA (detached), EB (semi-detached) and EW (contact)
Appendix B RRL Selection Function
Figure B.1 shows the selection function for the composite Gaia+ASAS+PS1 RRL catalogue as inferred by Mateu (2024), based on the method described in Mateu et al. (2020). The top panel shows the completeness of the RRL catalogue in the Z versus R plane. The middle panel shows the residuals obtained by subtracting from the completeness map a north-south flipped version of itself. The bottom panel shows the completeness as a function of R, separately for the north (blue) and south (red) hemispheres.
These maps illustrate there are no systematics in the selection function favouring a detection of RRL in any hemisphere versus the other. The map shows that although completeness starts to decrease towards the Galactic plane for the outermost radii (R > 16 kpc), it remains symmetric with respect to the Galactic midplane. It is worth stressing that these estimates are empirical and not based on any Galactic model and, so, there is no prior assumption of symmetry.
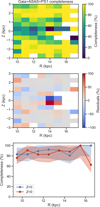 |
Fig. B.1 Gaia+ASAS+PS1 RRL catalogue completeness. Top: completeness in the Z vs R plane. Middle: Residuals in the Z vs R plane. Bottom: Completeness as a function of R for Z > 0 (blue) and Z < 0 (red). The shaded regions correspond to 1σ uncertainties. |
Appendix C The warp in the anticentre
Figure C.1 shows Z (top), Vz* (middle) and Vϕ* (bottom) as a function of the radius, with the black lines corresponding to the same means and uncertainties shown in Fig. 3. The black dots are the RRL stars with photometric metallicity and the empty dots are those with metallicity assigned. Because RRLs trace substructures such as the Sagittarius (Sgr, Ramos et al. 2022) and Monoceros (Ramos et al. 2021) streams, we checked whether these were contaminating our disc sample in the anticentre direction. The red curve shows Sagittarius track above the Galactic plane (solid curve) and below the plane (dashed curve). Our cut in Vϕ* to select disc RRL removes most of Sagittarius for R > 10 kpc and the cuts in |Z| < 3 kpc and 9.5 < R/kpc < 17 guarantee its absence in our final disc sample. Also we checked that none of the Sagittarius RRL from Ramos et al. (2022) match with our disc sample. For Monoceros, we do not find any RRL from our disc sample to trace the track reported by Ramos et al. (2021).
 |
Fig. C.1 The three panels show the mean as a function of the radius, the vertical height Z (top panel), the vertical velocity Vz* (middle) and the azimuthal velocity Vϕ* (bottom). In all panels the black dots are the RRL stars with photometric metallicity and the empty dots are those with metallicity assigned. The black line is the mean computed in 1 kpc radial bins in each panel. The grey shaded area corresponds to 1σ of the 300 bootstrapping realisations of the mean. The red curve shows the track of Sagittarius (Ramos et al. 2022) in the anticentre above the plane (solid curve) and below the plane (dashed line). |
Appendix D Pattern speed of the warp
The mean vertical velocity of the stars Vz and the mean vertical height Z are related by (see eq. 20 Chequers & Widrow 2017)
 (D.1)
(D.1)
where we have ignored the contribution of the radial velocity by the same argument given in (Cabrera-Gadea et al. 2024). The partial derivative with respect to time in Eq. D.1 contains all the contribution to Vz only by the changes in the warp structure given by its time evolution (patterns speed and changes in amplitudes of all modes). We will assume that the warp only rotates and all of its modes have the same pattern speed ω, then ∂tZ = -ω∂ϕZ. Given the similarity in Z and Vz in phase with that of the Cepheids shown in Fig. 2 seems reasonable to assume that A = 0. We therefore can calculate ω as
 (D.2)
(D.2)
In order to evaluate ∂ϕZ we fit in each radial bin a m = 1 mode and calculate its derivative. We measure Ω as the mean Vϕ* divided by the radius of the radial bin. Because we can apply Eq. D.2 in each radial bin, we get the pattern speed as a function of the radius.
References
- Ablimit, I., Zhao, G., Flynn, C., & Bird, S. A. 2020, ApJ, 895, L12 [Google Scholar]
- Amôres, E. B., Robin, A. C., & Reylé, C. 2017, A&A, 602, A67 [NASA ADS] [CrossRef] [EDP Sciences] [Google Scholar]
- Anders, F., Gispert, P., Ratcliffe, B., et al. 2023, A&A, 678, A158 [NASA ADS] [CrossRef] [EDP Sciences] [Google Scholar]
- Ardèvol, J., Monguió, M., Figueras, F., Romero-Gómez, M., & Carrasco, J. M. 2023, A&A, 678, A111 [NASA ADS] [CrossRef] [EDP Sciences] [Google Scholar]
- Astropy Collaboration (Price-Whelan, A. M., et al.) 2018, AJ, 156, 123 [Google Scholar]
- Bland-Hawthorn, J., & Tepper-García, T. 2021, MNRAS, 504, 3168 [CrossRef] [Google Scholar]
- Burke, B. F. 1957, AJ, 62, 90 [Google Scholar]
- Cabrera-Gadea, M., Mateu, C., Ramos, P., et al. 2024, MNRAS, 528, 4409 [NASA ADS] [CrossRef] [Google Scholar]
- Chen, X., Wang, S., Deng, L., et al. 2019, Nat. Astron., 3, 320 [NASA ADS] [CrossRef] [Google Scholar]
- Cheng, X., Anguiano, B., Majewski, S. R., et al. 2020, ApJ, 905, 49 [Google Scholar]
- Chequers, M. H., & Widrow, L. M. 2017, MNRAS, 472, 2751 [NASA ADS] [CrossRef] [Google Scholar]
- Chequers, M. H., Widrow, L. M., & Darling, K. 2018, MNRAS, 480, 4244 [CrossRef] [Google Scholar]
- Chrobáková, Ž., Nagy, R., & López-Corredoira, M. 2020, A&A, 637, A96 [NASA ADS] [CrossRef] [EDP Sciences] [Google Scholar]
- Clementini, G., Ripepi, V., Garofalo, A., et al. 2023, A&A, 674, A18 [NASA ADS] [CrossRef] [EDP Sciences] [Google Scholar]
- Das, P., Huang, Y., Ciuca˘, I., & Fragkoudi, F. 2024, MNRAS, 527, 4505 [Google Scholar]
- Dehnen, W., Semczuk, M., & Schönrich, R. 2023, MNRAS, 523, 1556 [NASA ADS] [CrossRef] [Google Scholar]
- Gaia Collaboration (Antoja, T., et al.) 2021, A&A, 649, A8 [EDP Sciences] [Google Scholar]
- Gaia Collaboration (Drimmel, R., et al.) 2023, A&A, 674, A37 [CrossRef] [EDP Sciences] [Google Scholar]
- Garofalo, A., Delgado, H. E., Sarro, L. M., et al. 2022, MNRAS, 513, 788 [NASA ADS] [CrossRef] [Google Scholar]
- Girardi, L. 2016, ARA&A, 54, 95 [Google Scholar]
- Green, G. M., Schlafly, E., Zucker, C., Speagle, J. S., & Finkbeiner, D. 2019, ApJ, 887, 93 [NASA ADS] [CrossRef] [Google Scholar]
- Han, J. J., Conroy, C., & Hernquist, L. 2023, Nat. Astron., 7, 1481 [CrossRef] [Google Scholar]
- Hawkins, K. 2023, MNRAS, 525, 3318 [NASA ADS] [CrossRef] [Google Scholar]
- He, Z. 2023, ApJ, 954, L9 [Google Scholar]
- Hunter, J. D. 2007, Comput. Sci. Eng., 9, 90 [NASA ADS] [CrossRef] [Google Scholar]
- Ideta, M., Hozumi, S., Tsuchiya, T., & Takizawa, M. 2000, MNRAS, 311, 733 [Google Scholar]
- Iorio, G., & Belokurov, V. 2021, MNRAS, 502, 5686 [Google Scholar]
- Ivezic´, Ž., Connolly, A., Vanderplas, J., & Gray, A. 2014a, Statistics, Data Mining and Machine Learning in Astronomy (Princeton University Press) [Google Scholar]
- Ivezic´, Ž., Connolly, A. J., VanderPlas, J. T., & Gray, A. 2014b, Statistics, Data Mining, and Machine Learning in Astronomy: A Practical Python Guide for the Analysis of Survey Data (Princeton: Princeton University Press) [Google Scholar]
- Iwanek, P., Poleski, R., Kozłowski, S., et al. 2023, ApJS, 264, 20 [NASA ADS] [CrossRef] [Google Scholar]
- Jayasinghe, T., Stanek, K. Z., Kochanek, C. S., et al. 2019, MNRAS, 486, 1907 [NASA ADS] [Google Scholar]
- Jeon, M., Kim, S. S., & Ann, H. B. 2009, ApJ, 696, 1899 [Google Scholar]
- Jónsson, V. H., & McMillan, P. J. 2024, A&A, 688, A38 [NASA ADS] [CrossRef] [EDP Sciences] [Google Scholar]
- Kinemuchi, K., Smith, H. A., Woz´niak, P. R., McKay, T. A., & ROTSE Collaboration. 2006, AJ, 132, 1202 [Google Scholar]
- Kluyver, T., Ragan-Kelley, B., Pérez, F., et al. 2016, in Positioning and Power in Academic Publishing: Players, Agents and Agendas, eds. F. Loizides, & B. Schmidt, IOS Press, 87 [Google Scholar]
- Layden, A. C. 1995, AJ, 110, 2288 [NASA ADS] [CrossRef] [Google Scholar]
- Li, X., Wang, H.-F., Luo, Y.-P., et al. 2023a, ApJ, 943, 88 [CrossRef] [Google Scholar]
- Li, X.-Y., Huang, Y., Liu, G.-C., Beers, T. C., & Zhang, H.-W. 2023b, ApJ, 944, 88 [NASA ADS] [CrossRef] [Google Scholar]
- Lindegren, L., Klioner, S. A., & Hernández, J. 2021, A&A, 649, A2 [NASA ADS] [CrossRef] [EDP Sciences] [Google Scholar]
- López-Corredoira, M., Cabrera-Lavers, A., Garzón, F., & Hammersley, P. L. 2002, A&A, 394, 883 [NASA ADS] [CrossRef] [EDP Sciences] [Google Scholar]
- Marsakov, V. A., Gozha, M. L., & Koval’, V. V. 2019, Astrophysics, 62, 467 [Google Scholar]
- Mateu, C. 2024, RNAAS, 8, 85 [Google Scholar]
- Mateu, C., & Vivas, A. K. 2018, MNRAS, 479, 211 [NASA ADS] [CrossRef] [Google Scholar]
- Mateu, C., Holl, B., De Ridder, J., & Rimoldini, L. 2020, MNRAS, 496, 3291 [Google Scholar]
- McMillan, P. J., Petersson, J., Tepper-Garcia, T., et al. 2022, MNRAS, 516, 4988 [NASA ADS] [CrossRef] [Google Scholar]
- Poggio, E., Drimmel, R., Andrae, R., et al. 2020, Nat. Astron., 4, 590 [NASA ADS] [CrossRef] [Google Scholar]
- Poggio, E., Laporte, C. F. P., Johnston, K. V., et al. 2021, MNRAS, 508, 541 [NASA ADS] [CrossRef] [Google Scholar]
- Poggio, E., Khanna, S., Drimmel, R., et al. 2025, A&A, 699, A199 [NASA ADS] [CrossRef] [EDP Sciences] [Google Scholar]
- Prudil, Z., Dékány, I., Grebel, E. K., & Kunder, A. 2020, MNRAS, 492, 3408 [Google Scholar]
- Ramos, P., Mateu, C., Antoja, T., et al. 2020, A&A, 640, C5 [NASA ADS] [CrossRef] [EDP Sciences] [Google Scholar]
- Ramos, P., Antoja, T., Mateu, C., et al. 2021, A&A, 646, A99 [EDP Sciences] [Google Scholar]
- Ramos, P., Antoja, T., Yuan, Z., et al. 2022, A&A, 666, A64 [NASA ADS] [CrossRef] [EDP Sciences] [Google Scholar]
- Reid, M. J., & Brunthaler, A. 2020, ApJ, 892, 39 [Google Scholar]
- Romero-Gómez, M., Mateu, C., Aguilar, L., Figueras, F., & Castro-Ginard, A. 2019, A&A, 627, A150 [NASA ADS] [CrossRef] [EDP Sciences] [Google Scholar]
- Roškar, R., Debattista, V. P., Brooks, A. M., et al. 2010, MNRAS, 408, 783 [CrossRef] [Google Scholar]
- Sanders, J. L., & Das, P. 2018, MNRAS, 481, 4093 [CrossRef] [Google Scholar]
- Sarbadhicary, S. K., Heiger, M., Badenes, C., et al. 2021, ApJ, 912, 140 [Google Scholar]
- Schönrich, R., Binney, J., & Dehnen, W. 2010, MNRAS, 403, 1829 [NASA ADS] [CrossRef] [Google Scholar]
- Semczuk, M., Łokas, E. L., D’Onghia, E., et al. 2020, MNRAS, 498, 3535 [NASA ADS] [CrossRef] [Google Scholar]
- Sesar, B., Hernitschek, N., Mitrovic´, S., et al. 2017, AJ, 153, 204 [NASA ADS] [CrossRef] [Google Scholar]
- Skowron, D. M., Skowron, J., Mróz, P., et al. 2019, Science, 365, 478 [Google Scholar]
- Sparke, L. S. 1984, MNRAS, 211, 911 [Google Scholar]
- Sun, W., Huang, Y., Shen, H., et al. 2024, ApJ, 961, 141 [Google Scholar]
- Taylor, M. B. 2005, in Astronomical Data Analysis Software and Systems XIV, eds. P. Shopbell, M. Britton, & R. Ebert, Astronomical Society of the Pacific Conference Series, 347, 29 [NASA ADS] [Google Scholar]
- Taylor, M. B. 2006, in Astronomical Data Analysis Software and Systems XV, eds. C. Gabriel, C. Arviset, D. Ponz, & S. Enrique, Astronomical Society of the Pacific Conference Series, 351, 666 [Google Scholar]
- Uppal, N., Ganesh, S., & Schultheis, M. 2024, MNRAS, 527, 4863 [Google Scholar]
- Vanderplas, J., Connolly, A., Ivezic´, Ž., & Gray, A. 2012, in Conference on Intelligent Data Understanding (CIDU), 47 [Google Scholar]
- Walt, S. v. d., Colbert, S. C., & Varoquaux, G. 2011, Comput. Sci. Eng., 13, 22 [Google Scholar]
- Wang, H. F., López-Corredoira, M., Huang, Y., et al. 2020, ApJ, 897, 119 [NASA ADS] [CrossRef] [Google Scholar]
- Yusifov, I. 2004, in The Magnetized Interstellar Medium, eds. B. Uyaniker, W. Reich, & R. Wielebinski, 165 [Google Scholar]
- Zinn, R., Chen, X., Layden, A. C., & Casetti-Dinescu, D. I. 2020, MNRAS, 492, 2161 [NASA ADS] [CrossRef] [Google Scholar]
As we will show in Sect. 3 this corresponds to the mean metallicity of kinematic-thin-disc RRL stars.
These starting radii may not be the same radius at which the entire warp begins.
To avoid misleading comparisons in our discussion we left out the old population result from Gaia Collaboration (2021) because their old population is selected by taking the stars below the turn off of an 8 Gyr old isochrone. In this selection, low-mass stars of any age coexist and it is not guaranteed that the eldest population dominates the sample.
Similar results were found from completely independent arguments and data by Sarbadhicary et al. (2021) for RRLs in the Large Magellanic Clouds.
All Tables
Results from each radial bin for the anticentre sample of kinematically selected thin disc RRL stars.
RRL stars rejected based on their light curves. Eclipsing binary types are denoted EA (detached), EB (semi-detached) and EW (contact)
All Figures
|
Fig. 1 Bimodality of the population of RRLs in velocity and metallicity. The first column shows the histogram of Vϕ* for the RRLs with measured (Li et al. 2023b) photometric metallicity (black) and those with assigned metallicities (green, see Sect. 2); the Gaussian mixture for the total sample solution is shown for illustration (dotted grey line). The second column shows the period-amplitude (V-band) diagram where red dots are fast rotating RRLs with Vϕ* < −170 km s−1 and blue dots are slower rotating RRLs with Vϕ* > −170 km s−1. The third column shows the Vϕ*, [Fe/H] plane for the RRLs with measured metallicities, with the black and blue vertical lines indicating Vϕ* = −230 km s−1 and Vϕ* = −170 km s−1, respectively for all panels. From top to bottom, each row corresponds to a different radial bin: R ∈ (9,11), (11,13), (13,15), (15,17) kpc. |
| In the text | |
|
Fig. 2 Mean Z and Vz over the XY plane for the RRL sample with photometric metallicity [Fe/H] > −1. In each hexagonal bin, the mean Z (left) and Vz (right) computed by a Gaussian extreme deconvolution are plotted. The RRL sample with R > 8 kpc is plotted with transparent black dots. Dashed lines indicate galactocentric rings at R = 10 kpc, 15 kpc, and 20 kpc. |
| In the text | |
|
Fig. 3 Mean vertical height Z (top) and mean vertical velocity Vz* (bottom) as a function of the galactocentric radius, R, at the anticentre direction. We show our result for the sample of RRLs (black) and Cepheids best-fit warp at the anticentre from Cabrera-Gadea et al. (2024, blue solid line), and for the Cepheids, measured in the same region and with the same method as the RRLs (dashed blue line). The shaded areas correspond to one standard deviation from 300 bootstrap realisations. For Vz*, we add the bulk population from Jónsson & McMillan (2024) (BP, yellow curve) and the result from Gaia Collaboration (2021) for the red clump (RC, brown curve) and intermediate population (IP, green curve). |
| In the text | |
|
Fig. 4 Pattern speed as a function of radius for the RRLs’ warp (black curve), Cepheids’ warp (blue curve), and the angular velocity of the RRLs (green curve). The grey shaded area shows the 15% and 85% percentiles of the pattern speed results from the bootstrap realisation, the dashed line shows the median of the realisations. |
| In the text | |
|
Fig. 5 Vertical velocity dispersion as a function of the galactocentric radius. Left: our results for the RRL (black curve) in the same vertical range as the result for 3-4 Gyr (dashed green curve) and >9 Gyr (red curve) by Das et al. (2024, D24). Right: vertical velocity dispersion for the total TnD RRL sample (black curve), for the Cepheids sample (blue dashed curve), for the red clump (red curve), and for the intermediate age population (green dashed curve) from Gaia Collaboration (2021) (GC21). |
| In the text | |
|
Fig. B.1 Gaia+ASAS+PS1 RRL catalogue completeness. Top: completeness in the Z vs R plane. Middle: Residuals in the Z vs R plane. Bottom: Completeness as a function of R for Z > 0 (blue) and Z < 0 (red). The shaded regions correspond to 1σ uncertainties. |
| In the text | |
|
Fig. C.1 The three panels show the mean as a function of the radius, the vertical height Z (top panel), the vertical velocity Vz* (middle) and the azimuthal velocity Vϕ* (bottom). In all panels the black dots are the RRL stars with photometric metallicity and the empty dots are those with metallicity assigned. The black line is the mean computed in 1 kpc radial bins in each panel. The grey shaded area corresponds to 1σ of the 300 bootstrapping realisations of the mean. The red curve shows the track of Sagittarius (Ramos et al. 2022) in the anticentre above the plane (solid curve) and below the plane (dashed line). |
| In the text | |
Current usage metrics show cumulative count of Article Views (full-text article views including HTML views, PDF and ePub downloads, according to the available data) and Abstracts Views on Vision4Press platform.
Data correspond to usage on the plateform after 2015. The current usage metrics is available 48-96 hours after online publication and is updated daily on week days.
Initial download of the metrics may take a while.