Fig. 2
Download original image
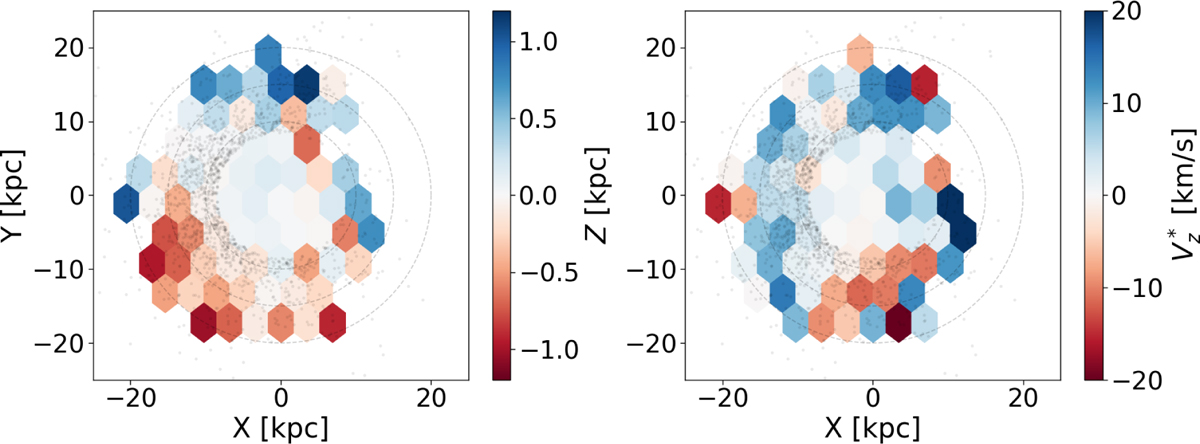
Mean Z and Vz over the XY plane for the RRL sample with photometric metallicity [Fe/H] > −1. In each hexagonal bin, the mean Z (left) and Vz (right) computed by a Gaussian extreme deconvolution are plotted. The RRL sample with R > 8 kpc is plotted with transparent black dots. Dashed lines indicate galactocentric rings at R = 10 kpc, 15 kpc, and 20 kpc.
Current usage metrics show cumulative count of Article Views (full-text article views including HTML views, PDF and ePub downloads, according to the available data) and Abstracts Views on Vision4Press platform.
Data correspond to usage on the plateform after 2015. The current usage metrics is available 48-96 hours after online publication and is updated daily on week days.
Initial download of the metrics may take a while.