Fig. 3
Download original image
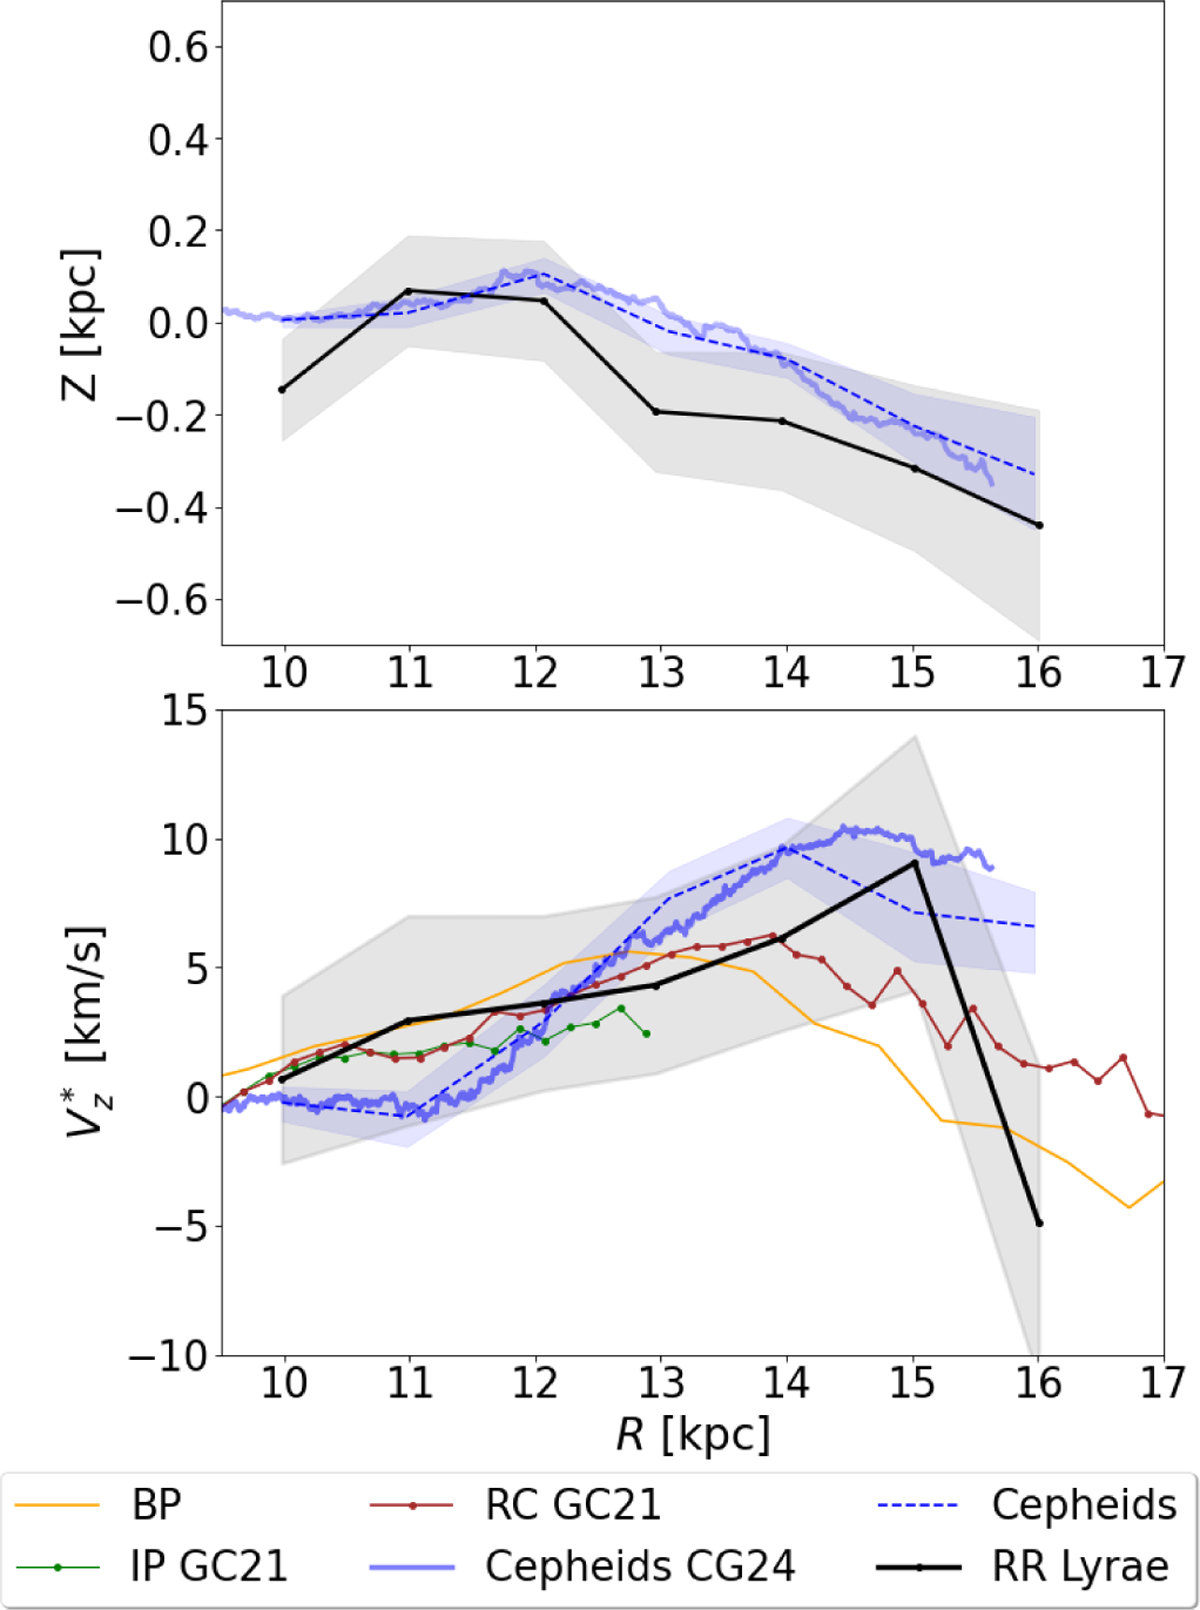
Mean vertical height Z (top) and mean vertical velocity Vz* (bottom) as a function of the galactocentric radius, R, at the anticentre direction. We show our result for the sample of RRLs (black) and Cepheids best-fit warp at the anticentre from Cabrera-Gadea et al. (2024, blue solid line), and for the Cepheids, measured in the same region and with the same method as the RRLs (dashed blue line). The shaded areas correspond to one standard deviation from 300 bootstrap realisations. For Vz*, we add the bulk population from Jónsson & McMillan (2024) (BP, yellow curve) and the result from Gaia Collaboration (2021) for the red clump (RC, brown curve) and intermediate population (IP, green curve).
Current usage metrics show cumulative count of Article Views (full-text article views including HTML views, PDF and ePub downloads, according to the available data) and Abstracts Views on Vision4Press platform.
Data correspond to usage on the plateform after 2015. The current usage metrics is available 48-96 hours after online publication and is updated daily on week days.
Initial download of the metrics may take a while.