Open Access
Fig. 4
Download original image
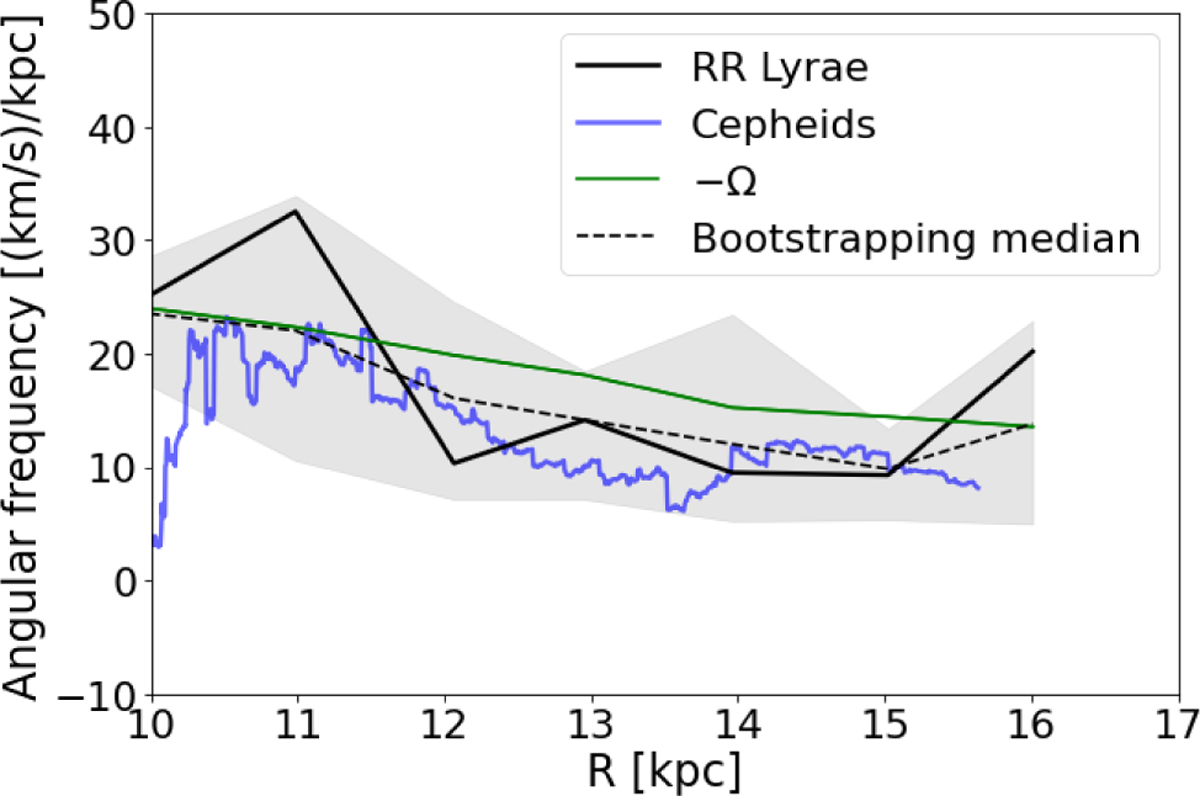
Pattern speed as a function of radius for the RRLs’ warp (black curve), Cepheids’ warp (blue curve), and the angular velocity of the RRLs (green curve). The grey shaded area shows the 15% and 85% percentiles of the pattern speed results from the bootstrap realisation, the dashed line shows the median of the realisations.
Current usage metrics show cumulative count of Article Views (full-text article views including HTML views, PDF and ePub downloads, according to the available data) and Abstracts Views on Vision4Press platform.
Data correspond to usage on the plateform after 2015. The current usage metrics is available 48-96 hours after online publication and is updated daily on week days.
Initial download of the metrics may take a while.