Fig. 5
Download original image
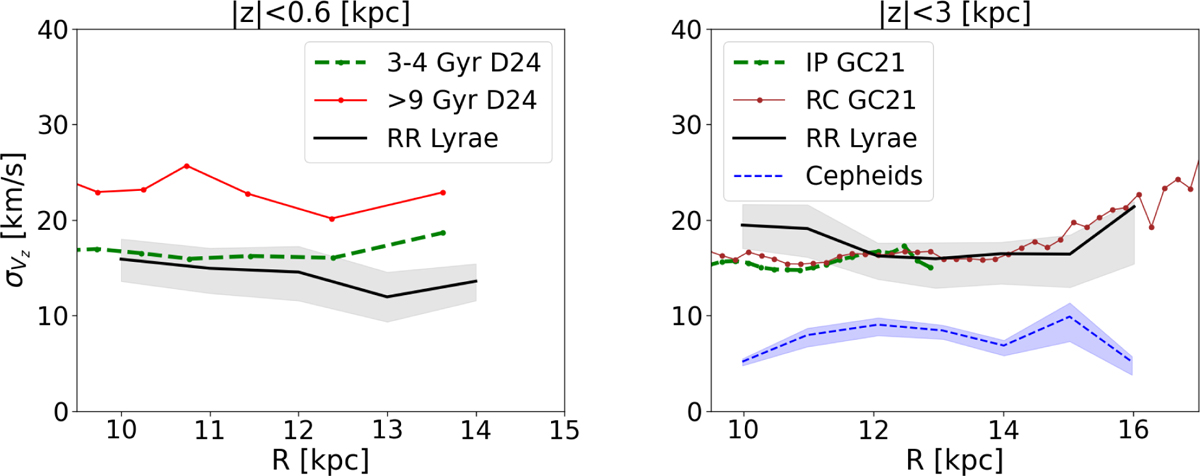
Vertical velocity dispersion as a function of the galactocentric radius. Left: our results for the RRL (black curve) in the same vertical range as the result for 3-4 Gyr (dashed green curve) and >9 Gyr (red curve) by Das et al. (2024, D24). Right: vertical velocity dispersion for the total TnD RRL sample (black curve), for the Cepheids sample (blue dashed curve), for the red clump (red curve), and for the intermediate age population (green dashed curve) from Gaia Collaboration (2021) (GC21).
Current usage metrics show cumulative count of Article Views (full-text article views including HTML views, PDF and ePub downloads, according to the available data) and Abstracts Views on Vision4Press platform.
Data correspond to usage on the plateform after 2015. The current usage metrics is available 48-96 hours after online publication and is updated daily on week days.
Initial download of the metrics may take a while.