Fig. C.1
Download original image
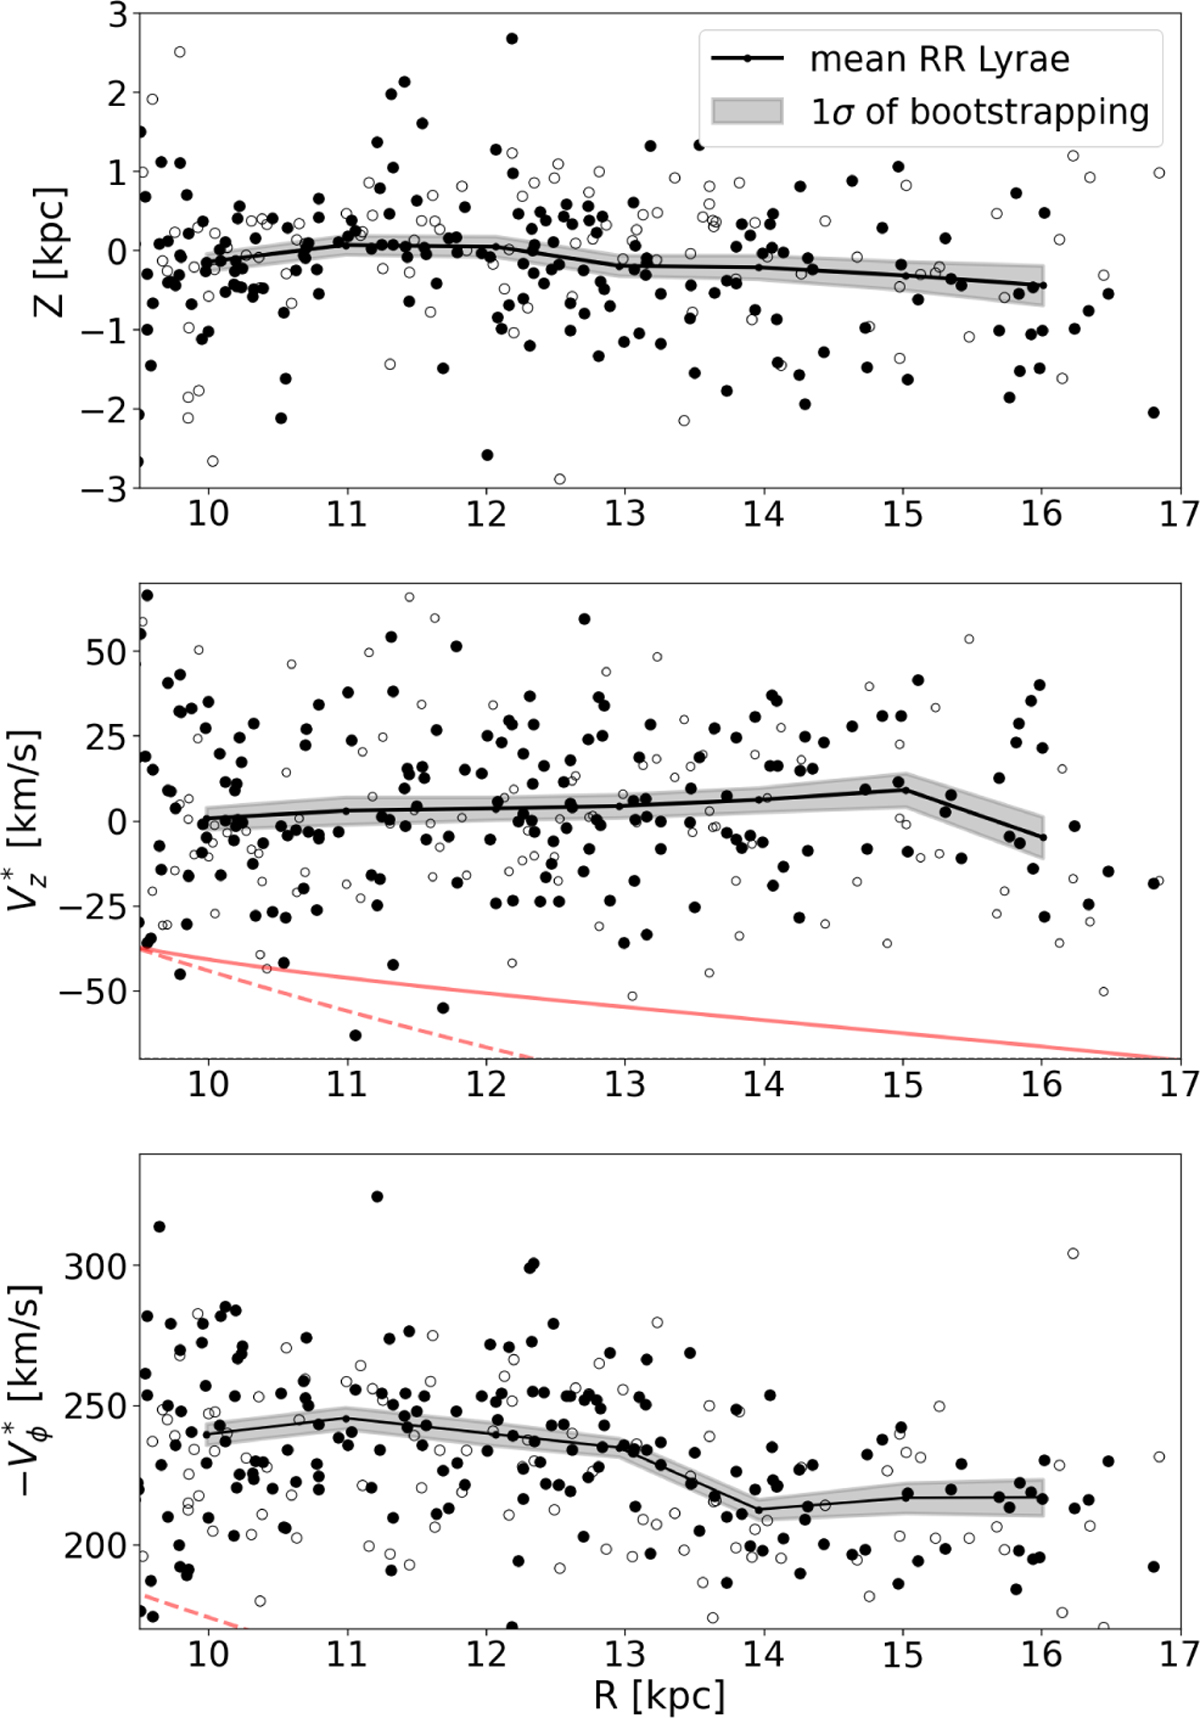
The three panels show the mean as a function of the radius, the vertical height Z (top panel), the vertical velocity Vz* (middle) and the azimuthal velocity Vϕ* (bottom). In all panels the black dots are the RRL stars with photometric metallicity and the empty dots are those with metallicity assigned. The black line is the mean computed in 1 kpc radial bins in each panel. The grey shaded area corresponds to 1σ of the 300 bootstrapping realisations of the mean. The red curve shows the track of Sagittarius (Ramos et al. 2022) in the anticentre above the plane (solid curve) and below the plane (dashed line).
Current usage metrics show cumulative count of Article Views (full-text article views including HTML views, PDF and ePub downloads, according to the available data) and Abstracts Views on Vision4Press platform.
Data correspond to usage on the plateform after 2015. The current usage metrics is available 48-96 hours after online publication and is updated daily on week days.
Initial download of the metrics may take a while.