Open Access
Fig. 10
Download original image
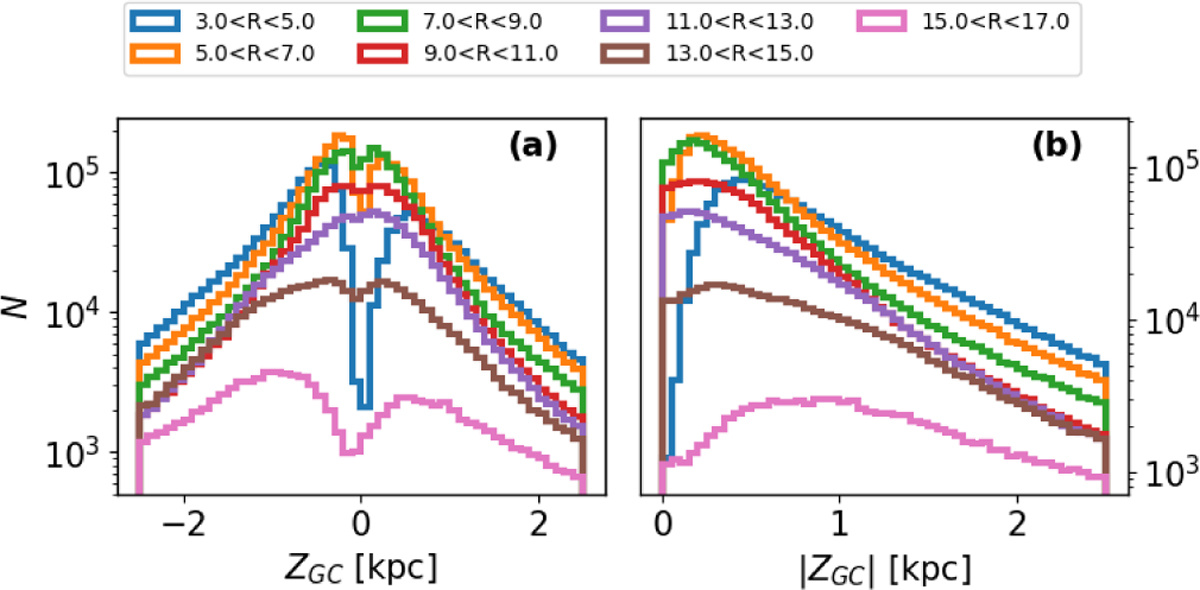
Vertical counts of ɡdr3wise[RC] for successive annuli in R between 3 and 15 kpc. Panel a shows the counts as a function of ZGC, while panel b shows the same folded along the vertical axis, i.e. |ZGC|. In panel b, a change of slope in the vertical counts is evident as we move from the inner to the outer disc region.
Current usage metrics show cumulative count of Article Views (full-text article views including HTML views, PDF and ePub downloads, according to the available data) and Abstracts Views on Vision4Press platform.
Data correspond to usage on the plateform after 2015. The current usage metrics is available 48-96 hours after online publication and is updated daily on week days.
Initial download of the metrics may take a while.