Fig. 18
Download original image
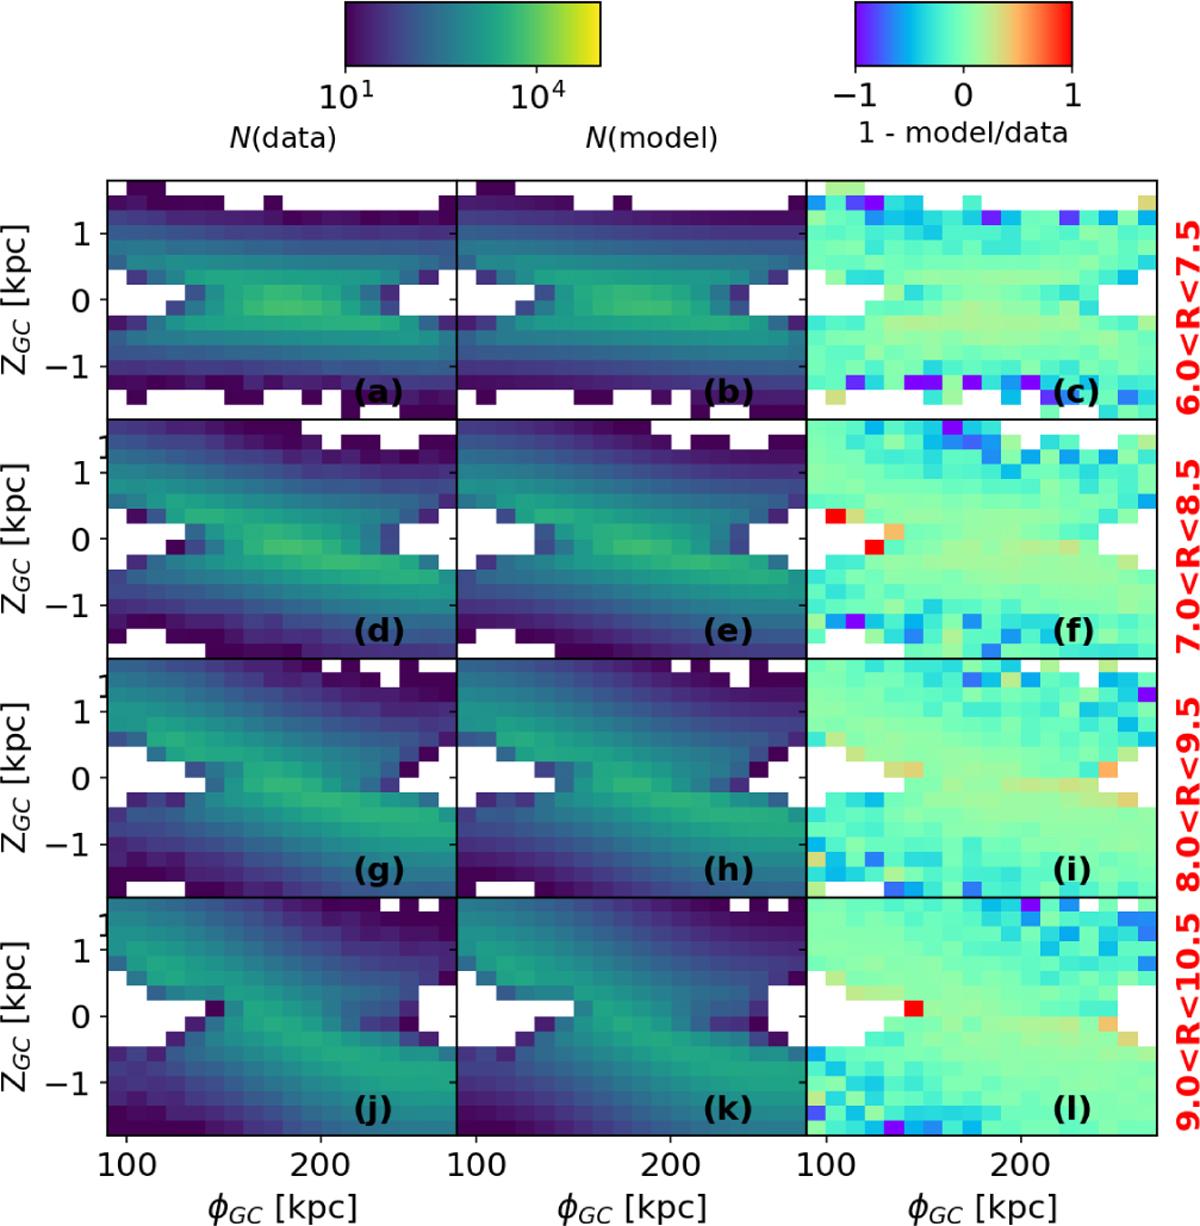
Mock case II: fitting residuals shown in ϕ-ZGC projection. Panel a shows the number density (logarithmic scale) of the mock data, panel b shows the predicted number density of the best-fitted model, and panel c shows the residual (relative to mock data). Panels a–c are restricted to 6<R<7.5 kpc. The subsequent rows show the same information but for selected successive bins in R.
Current usage metrics show cumulative count of Article Views (full-text article views including HTML views, PDF and ePub downloads, according to the available data) and Abstracts Views on Vision4Press platform.
Data correspond to usage on the plateform after 2015. The current usage metrics is available 48-96 hours after online publication and is updated daily on week days.
Initial download of the metrics may take a while.