Open Access
Fig. 19
Download original image
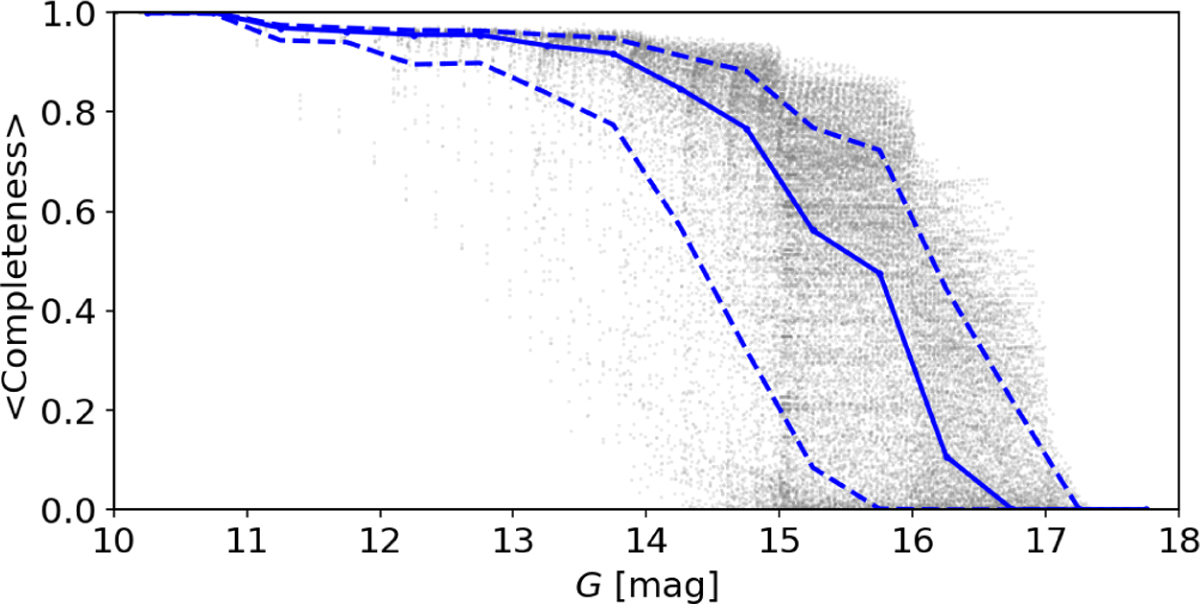
Completeness for the RC sample for R >3 kpc, shown in gray, as a function of G magnitude (0.5 mag bins). The blue solid line shows the median profile, and the dotted lines show the 84th and 16th percentiles.
Current usage metrics show cumulative count of Article Views (full-text article views including HTML views, PDF and ePub downloads, according to the available data) and Abstracts Views on Vision4Press platform.
Data correspond to usage on the plateform after 2015. The current usage metrics is available 48-96 hours after online publication and is updated daily on week days.
Initial download of the metrics may take a while.