Fig. 2
Download original image
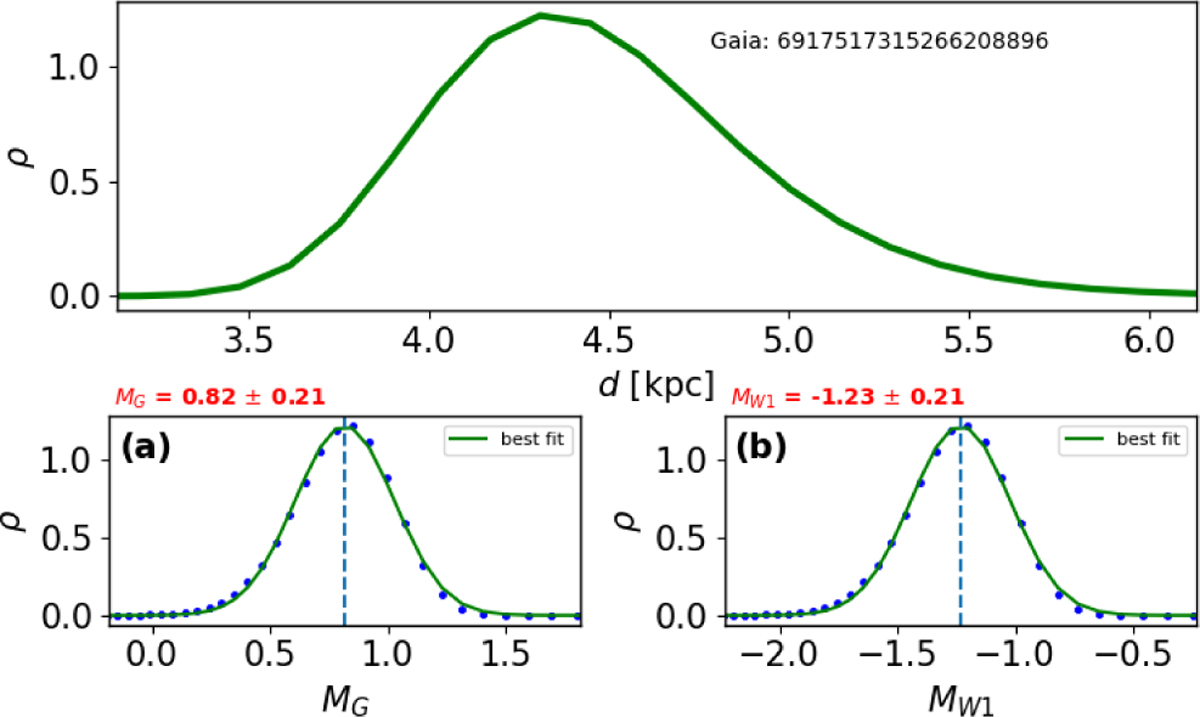
Procedure to obtain the distribution of the absolute magnitude starting from distance priors illustrated for an example source. The top inset shows the distance prior used, which is turned into a grid of absolute magnitude using 3D extinction maps. The bottom figures show a Gaussian fit to the resulting absolute magnitude distributions in the G and W1 bands used to select the RC candidates.
Current usage metrics show cumulative count of Article Views (full-text article views including HTML views, PDF and ePub downloads, according to the available data) and Abstracts Views on Vision4Press platform.
Data correspond to usage on the plateform after 2015. The current usage metrics is available 48-96 hours after online publication and is updated daily on week days.
Initial download of the metrics may take a while.