Fig. 22
Download original image
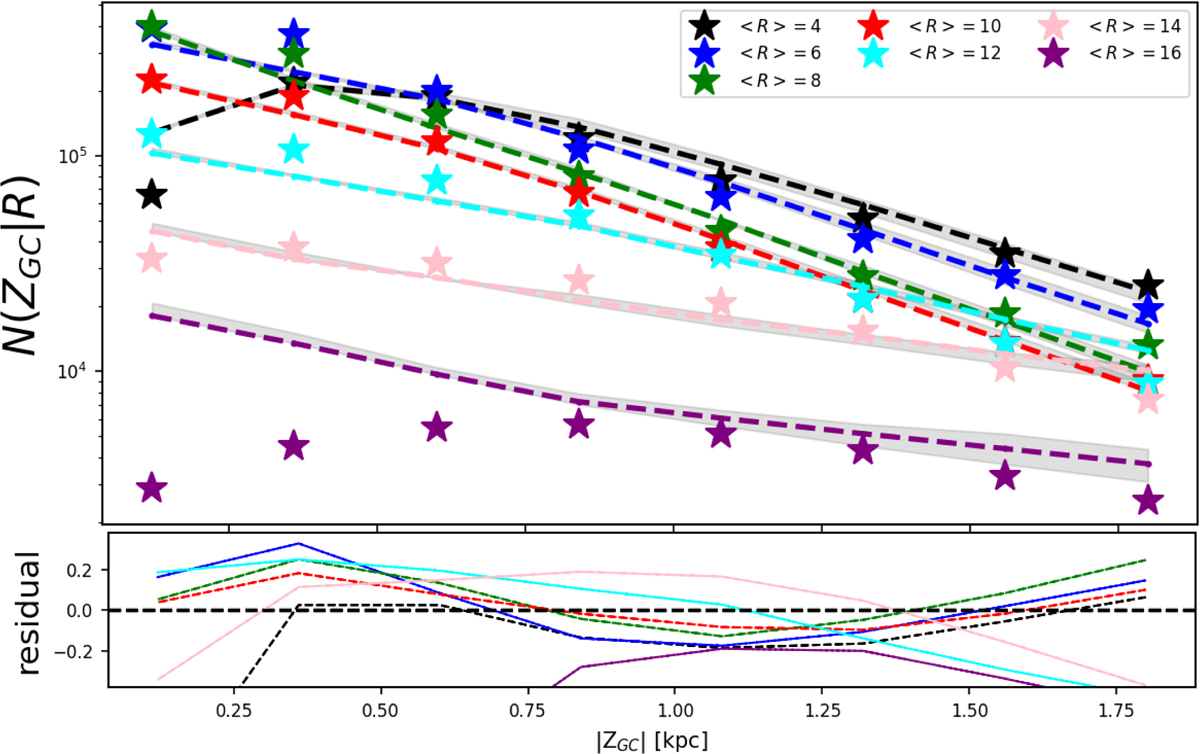
Vertical counts as a function of |ZGC| at progressive annuli in R (2 kpc wide). In each case, the data are shown as stars, and the predictions from Model 2 as dashed lines in the same colour. The uncertainties in the best-fit model are represented by the shaded grey area. The residuals between data and model are shown in the lower panel.
Current usage metrics show cumulative count of Article Views (full-text article views including HTML views, PDF and ePub downloads, according to the available data) and Abstracts Views on Vision4Press platform.
Data correspond to usage on the plateform after 2015. The current usage metrics is available 48-96 hours after online publication and is updated daily on week days.
Initial download of the metrics may take a while.