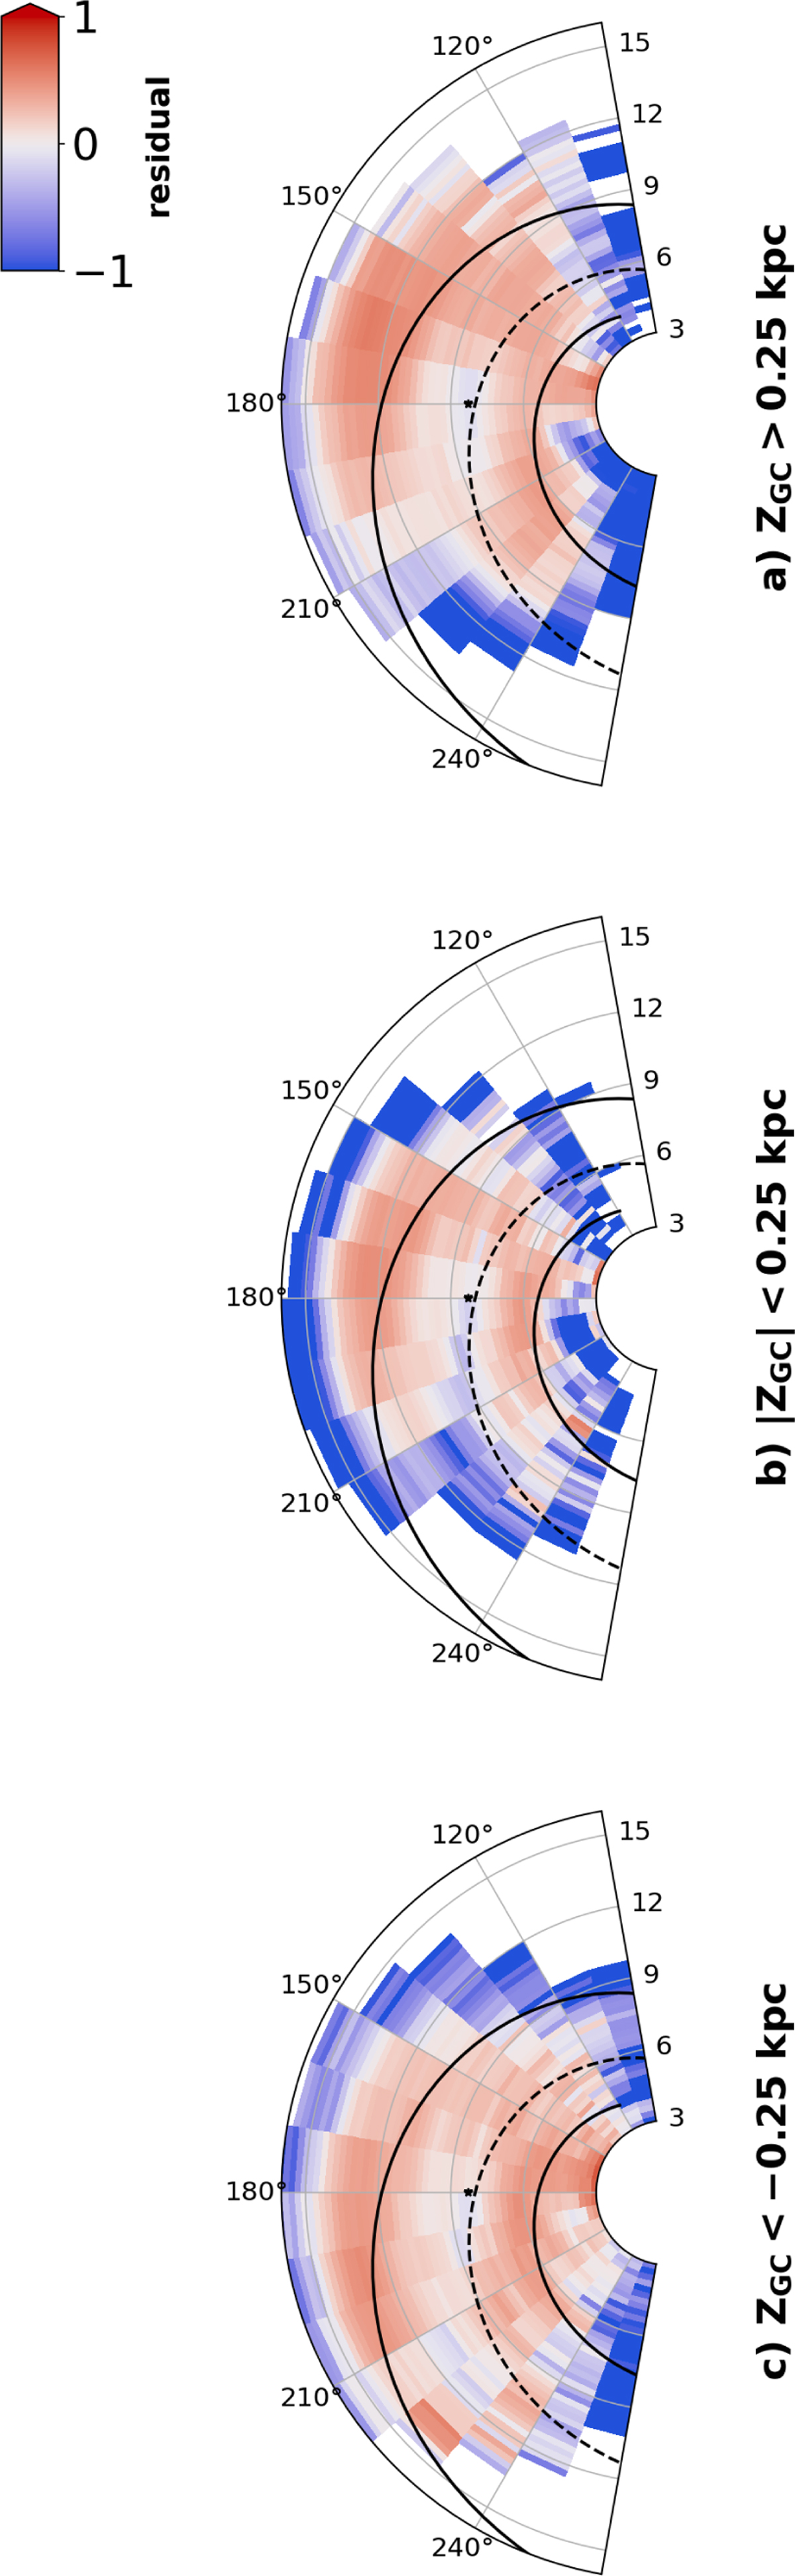
Fig. 25
Download original image
Relative residual (1-model/data) for Model 2 from Table 4, applied to ɡdr3wise[RC], and shown in polar coordinates. The residuals are shown for three slices in ZGC above the plane (panel a), in the midplane (panel b), and below the plane (panel c). The two-arm NIR spiral model from Drimmel (2000) is overplotted as black curves.
Current usage metrics show cumulative count of Article Views (full-text article views including HTML views, PDF and ePub downloads, according to the available data) and Abstracts Views on Vision4Press platform.
Data correspond to usage on the plateform after 2015. The current usage metrics is available 48-96 hours after online publication and is updated daily on week days.
Initial download of the metrics may take a while.