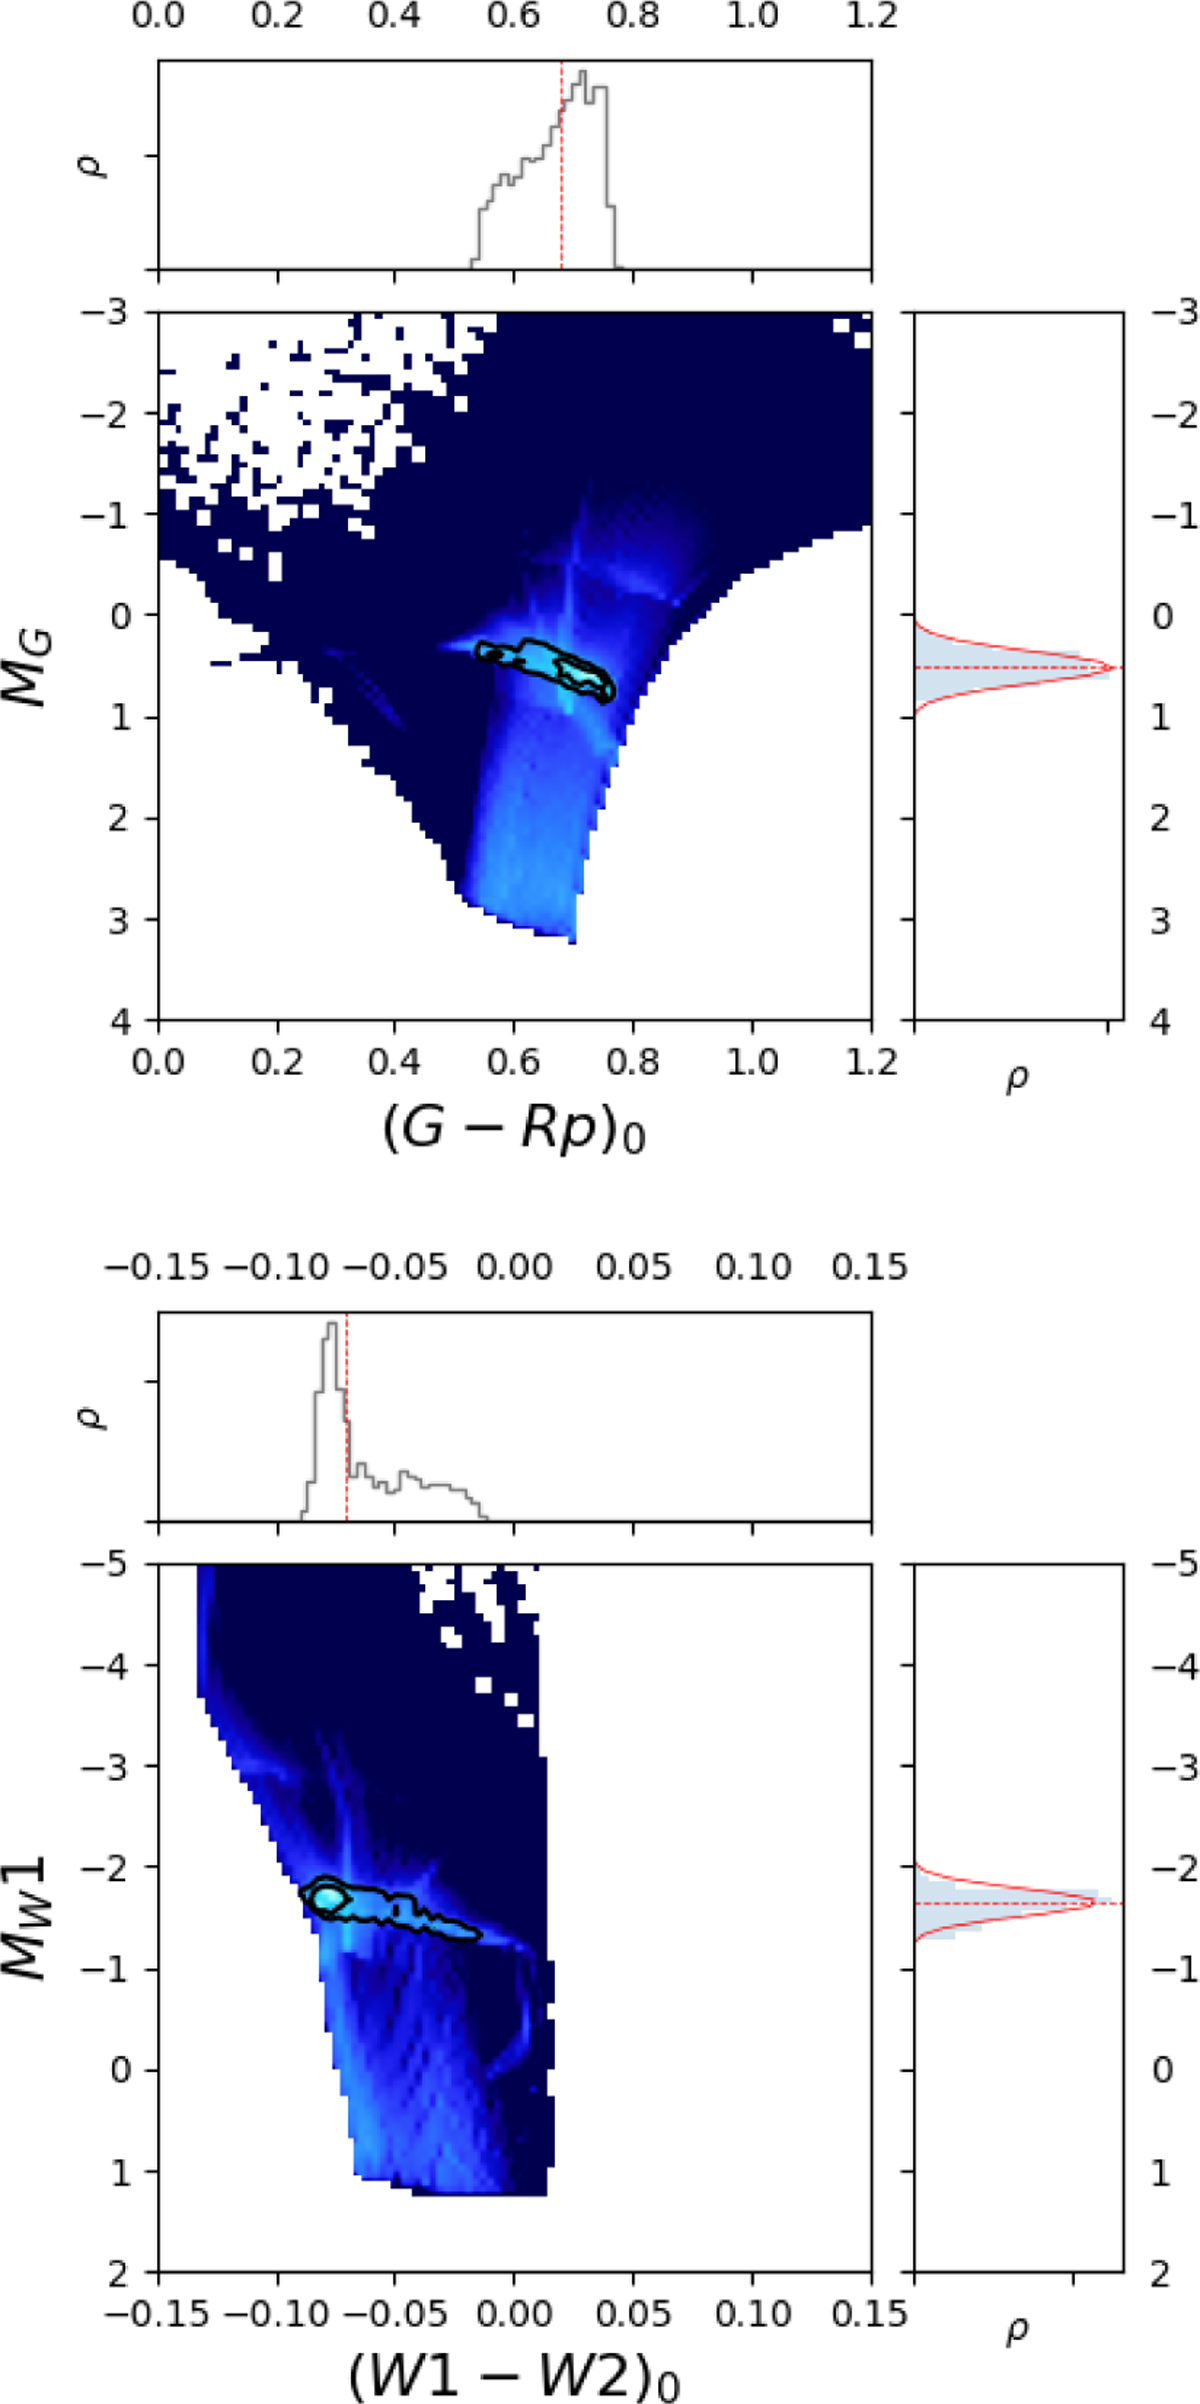
Fig. 3
Download original image
Distribution of giants on the CaMD diagram in a mock realisation of the Milky Way using the Galaxia code (see Appendix C.2). The top panel shows MG vs Gaia colours, while the bottom panel shows MW1 versus AllWISE colours. The RC is marked by the black contours. The marginalised histogram (normalised) for the x (top sub panel) and y (right sub panel) axes are also shown. For the RC, both MG and MW1 can be approximated by a quasi-Gaussian as is shown by the red curves on the right insets.
Current usage metrics show cumulative count of Article Views (full-text article views including HTML views, PDF and ePub downloads, according to the available data) and Abstracts Views on Vision4Press platform.
Data correspond to usage on the plateform after 2015. The current usage metrics is available 48-96 hours after online publication and is updated daily on week days.
Initial download of the metrics may take a while.