Open Access
Fig. C.2
Download original image
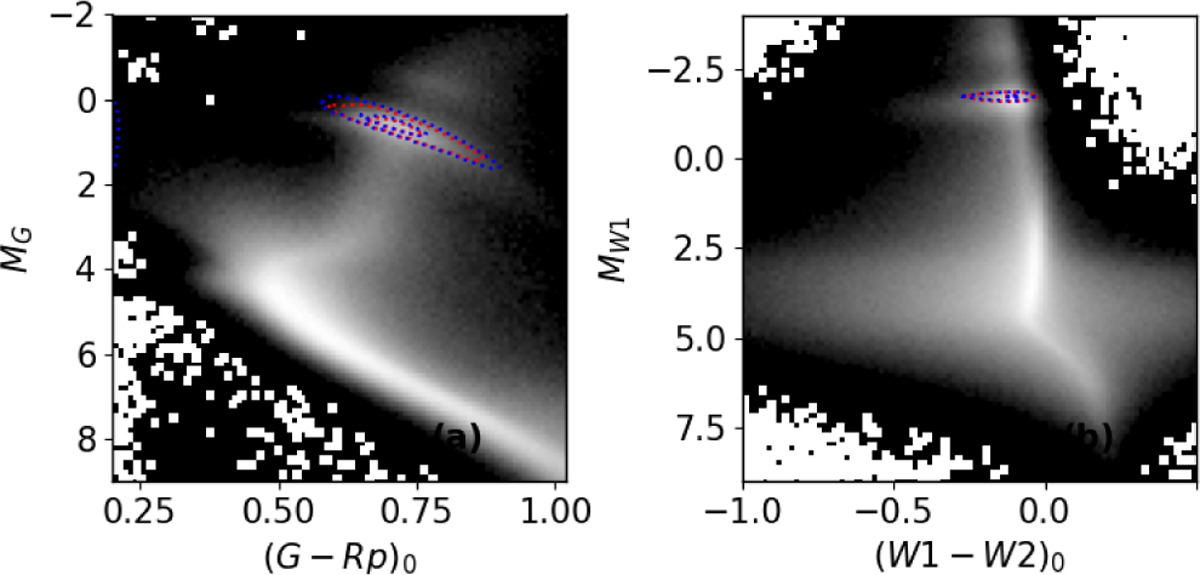
Colour-absolute magnitude diagram for the ɡdr3wise dataset, with MG vs (G – GRP)0 shown in panel (a), and MW1 vs (W1 – W2)0 shown in panel (b). The red contours in each panel represent the selected ɡdr3wise[RC] stars. Also, shown in blue contours are the spectroscopically selected RC from A23.
Current usage metrics show cumulative count of Article Views (full-text article views including HTML views, PDF and ePub downloads, according to the available data) and Abstracts Views on Vision4Press platform.
Data correspond to usage on the plateform after 2015. The current usage metrics is available 48-96 hours after online publication and is updated daily on week days.
Initial download of the metrics may take a while.