Fig. 5
Download original image
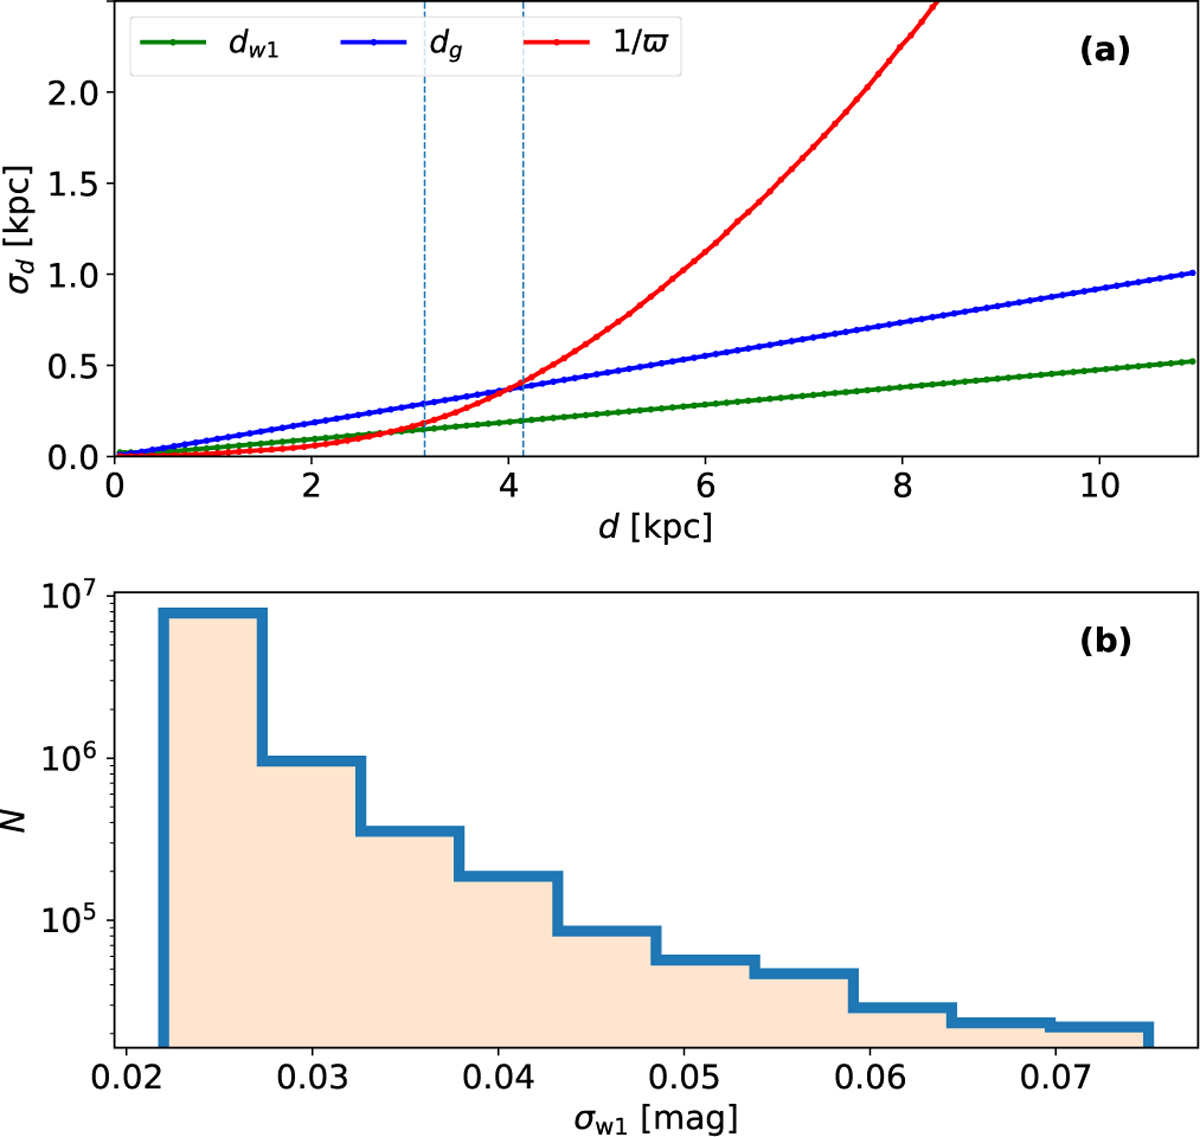
Panel a: typical distance uncertainty for the red clump as a function of distance. The red curve shows the expectation from a naive inverse parallax estimation, the blue curve shows the predicted uncertainties in the photometric distances in G band and for W1 this is shown by the green curve. The two vertical dotted lines indicate roughly the distances beyond which the photometric distances become more informative than parallax inversion for the two bands. Panel b: distribution of photometric uncertainty in W1 for the RC stars shows that σw1 ≪ 0.1, i.e. lower than the intrinsic dispersion in the absolute magnitude of RC stars in W1.
Current usage metrics show cumulative count of Article Views (full-text article views including HTML views, PDF and ePub downloads, according to the available data) and Abstracts Views on Vision4Press platform.
Data correspond to usage on the plateform after 2015. The current usage metrics is available 48-96 hours after online publication and is updated daily on week days.
Initial download of the metrics may take a while.