Fig. 8
Download original image
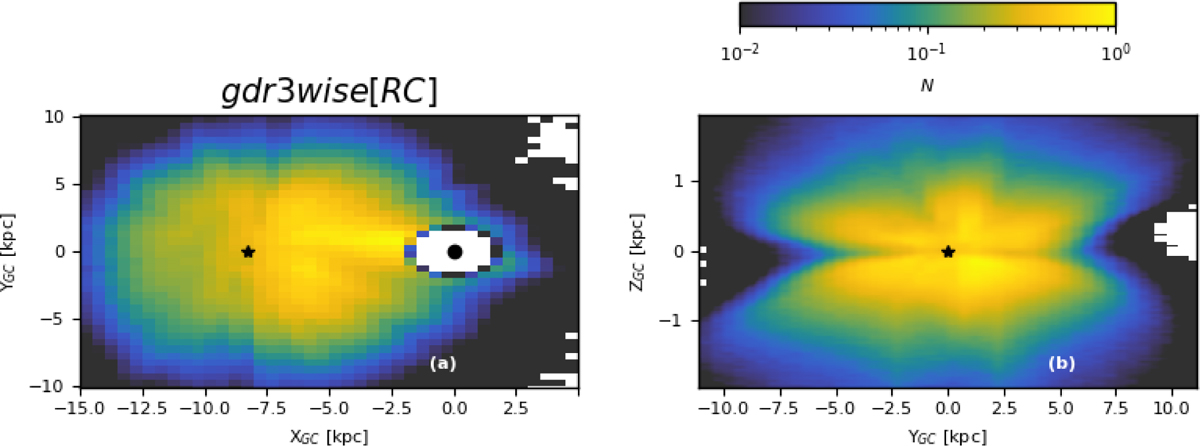
Spatial distribution of the ɡdr3wise[RC] sample for the region considered for model fitting. Panel a shows the galactocentric XGC–YGC projection, with the location of the Sun (black star) and the Galactic centre (black dot) also indicated. Stars within R < 3kpc of the Galactic centre have been removed. Panel b shows the corresponding galactocentric YGC–ZGC projection. The number density is shown on a logarithmic scale.
Current usage metrics show cumulative count of Article Views (full-text article views including HTML views, PDF and ePub downloads, according to the available data) and Abstracts Views on Vision4Press platform.
Data correspond to usage on the plateform after 2015. The current usage metrics is available 48-96 hours after online publication and is updated daily on week days.
Initial download of the metrics may take a while.