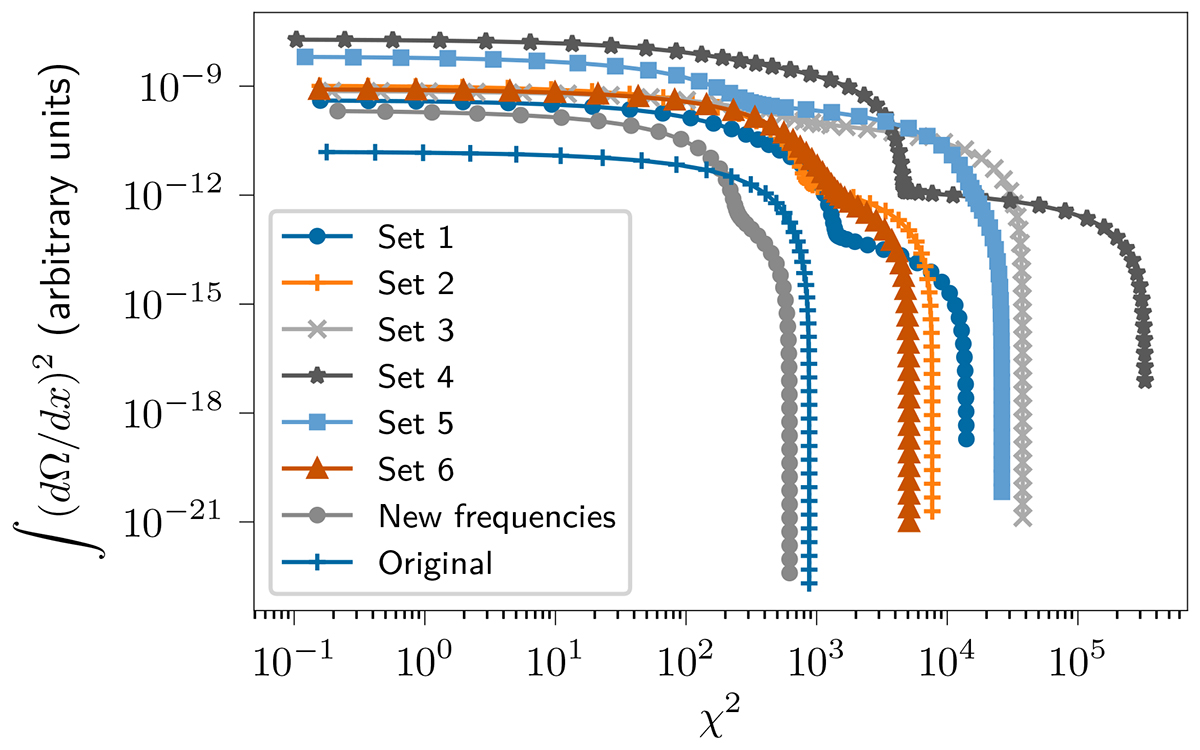
Fig. 3.
Download original image
L-curve for the best forward model (see Table 1) from each model set, with the regularisation parameter ranging from 103 to 1010. The x-axis is the goodness of fit, given by the χobs2. The y-axis shows the RLS penalty term, which is the integral of the square of the derivative of the profile. The optimal value for the regularisation according to the L-curve criterion should be in the hook of the L shapes in the profiles.
Current usage metrics show cumulative count of Article Views (full-text article views including HTML views, PDF and ePub downloads, according to the available data) and Abstracts Views on Vision4Press platform.
Data correspond to usage on the plateform after 2015. The current usage metrics is available 48-96 hours after online publication and is updated daily on week days.
Initial download of the metrics may take a while.