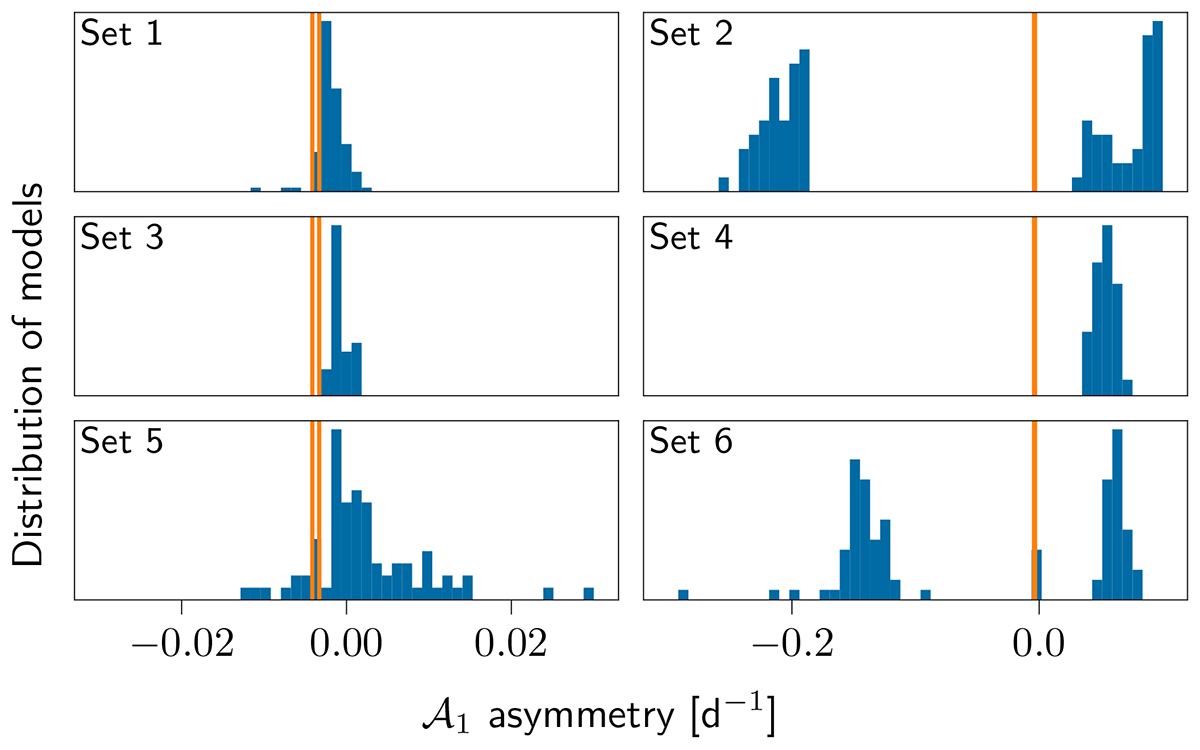
Fig. 8.
Download original image
Distribution of the theoretical 𝒜1 asymmetries for the quad1 ℓ = 2 multiplet. Each panel is a different set, as indicated in the top-left corner of the panel. The vertical orange line indicates the observed asymmetry. Since the multiplet is not complete, the 𝒜1 asymmetries have two observed values, which can be seen in the left panels as the two separate lines. The scale of the x-axis in the right panel is too large to show the two values. The radial orders associated with these asymmetries can be found in Table 2 under the quad1 multiplet.
Current usage metrics show cumulative count of Article Views (full-text article views including HTML views, PDF and ePub downloads, according to the available data) and Abstracts Views on Vision4Press platform.
Data correspond to usage on the plateform after 2015. The current usage metrics is available 48-96 hours after online publication and is updated daily on week days.
Initial download of the metrics may take a while.