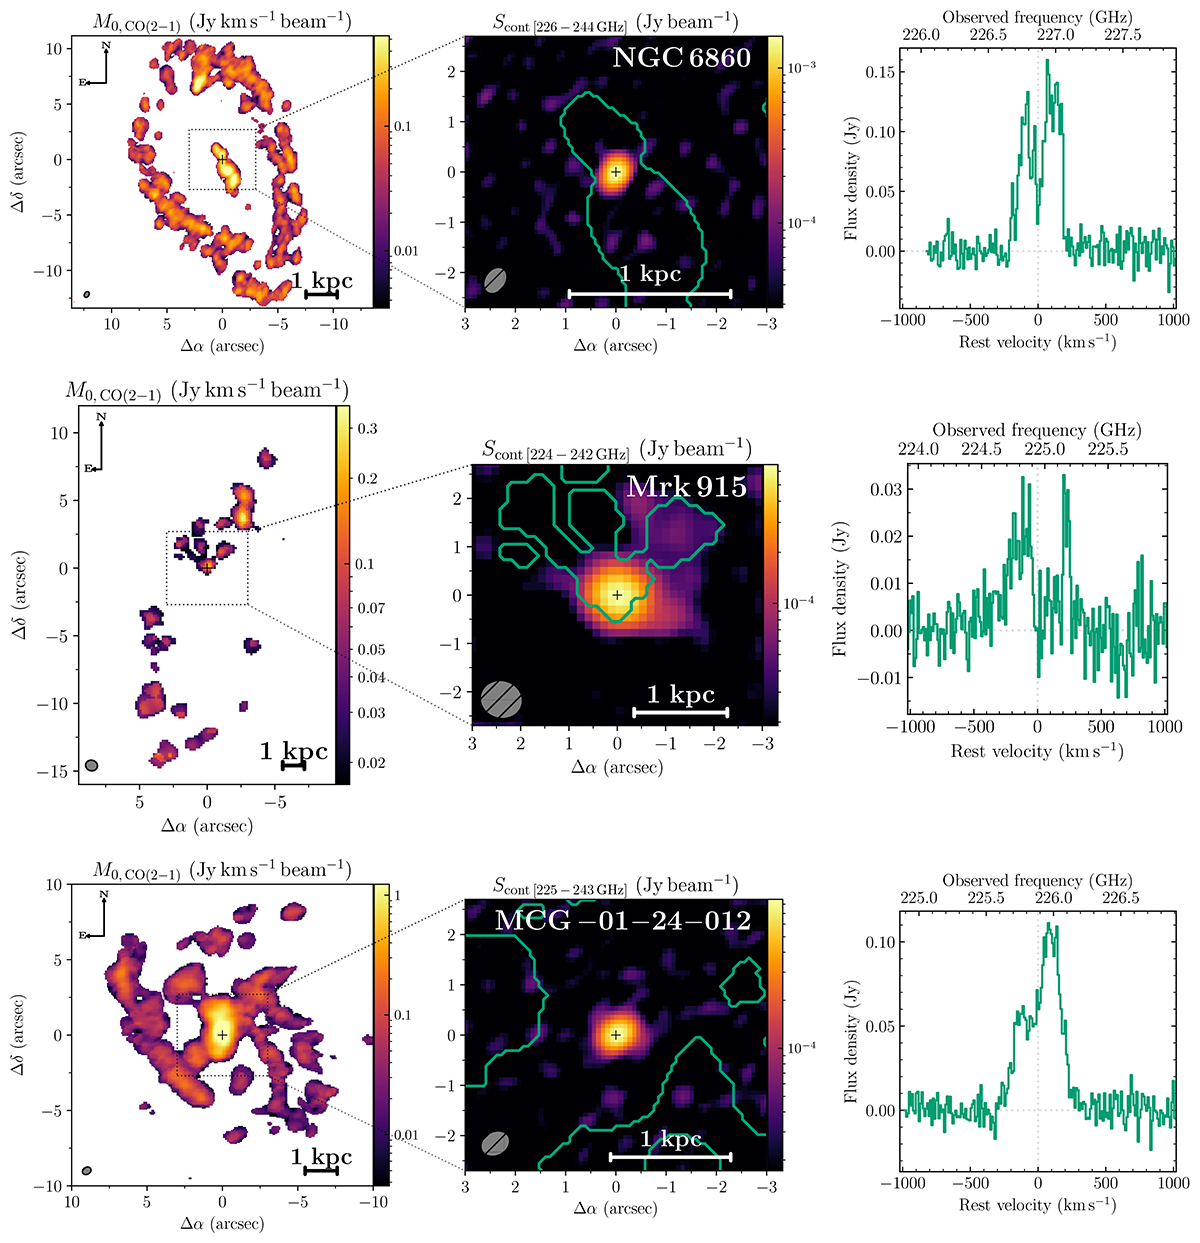
Fig. 2.
Download original image
Overview of the final reduced ALMA data, showing one object per row. Left: CO(2−1) moment M0, corresponding to the integrated flux. Center: ALMA millimeter continuum flux density near the CO spectral region, with M0 outline here with a bluish-green contour. Right: CO(2−1) spectral profile, integrated over the whole FoV (only spaxels not masked on the M0 map), showing the flux density vs. rest velocity (or observed frequency, in the top). The coordinates are relative to the galactic nucleus (black cross marks), assumed to be located at the ALMA millimeter continuum peak (see Table 1). The gray ellipses represent the ALMA beam resolution of the observation.
Current usage metrics show cumulative count of Article Views (full-text article views including HTML views, PDF and ePub downloads, according to the available data) and Abstracts Views on Vision4Press platform.
Data correspond to usage on the plateform after 2015. The current usage metrics is available 48-96 hours after online publication and is updated daily on week days.
Initial download of the metrics may take a while.