Fig. 4.
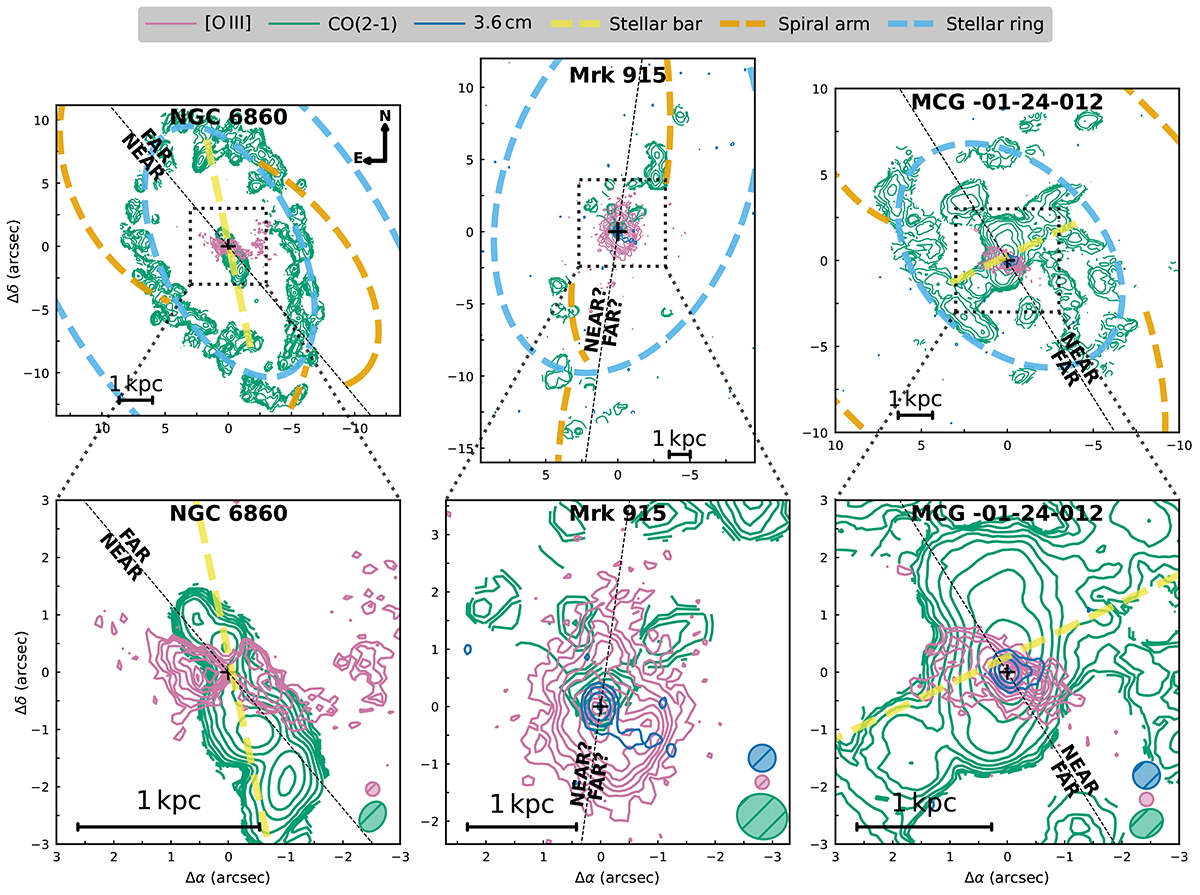
Download original image
Contours showing the flux distribution from the CO(2−1) cold molecular gas (M0, in bluish-green), [O III] ionized gas (reddish-purple), and the 3.6 cm radio (blue), with a zoom-in of the nuclear 3″ × 3″ region (bottom panels). The dashed yellow, orange, and sky-blue lines correspond to stellar bar, spiral arm, and stellar ring structures, respectively (identified in Fig. 4). Colored ellipses represent the beam resolutions of each contour image, using the same color as the tracer. Contours are evenly spaced logarithmically. There are: 10 CO(2−1) contour levels in the ranges (0.508, 47.8), (0.620, 28.0), and (0.359, 93.5) Jy km s−1, for NGC 6860, Mrk 915, and MCG -01-24-012, respectively; 10 [O III] levels in the ranges (10−18.3, 10−16.4), (10−18.2, 10−15.7), and (10−18.3, 10−16.2) erg s−1 cm−2 Å, in the same order; and 4 radio levels in the ranges (10.2, 1202) and (10.35, 713) mJy, for Mrk 915 and MCG -01-24-012.
Current usage metrics show cumulative count of Article Views (full-text article views including HTML views, PDF and ePub downloads, according to the available data) and Abstracts Views on Vision4Press platform.
Data correspond to usage on the plateform after 2015. The current usage metrics is available 48-96 hours after online publication and is updated daily on week days.
Initial download of the metrics may take a while.