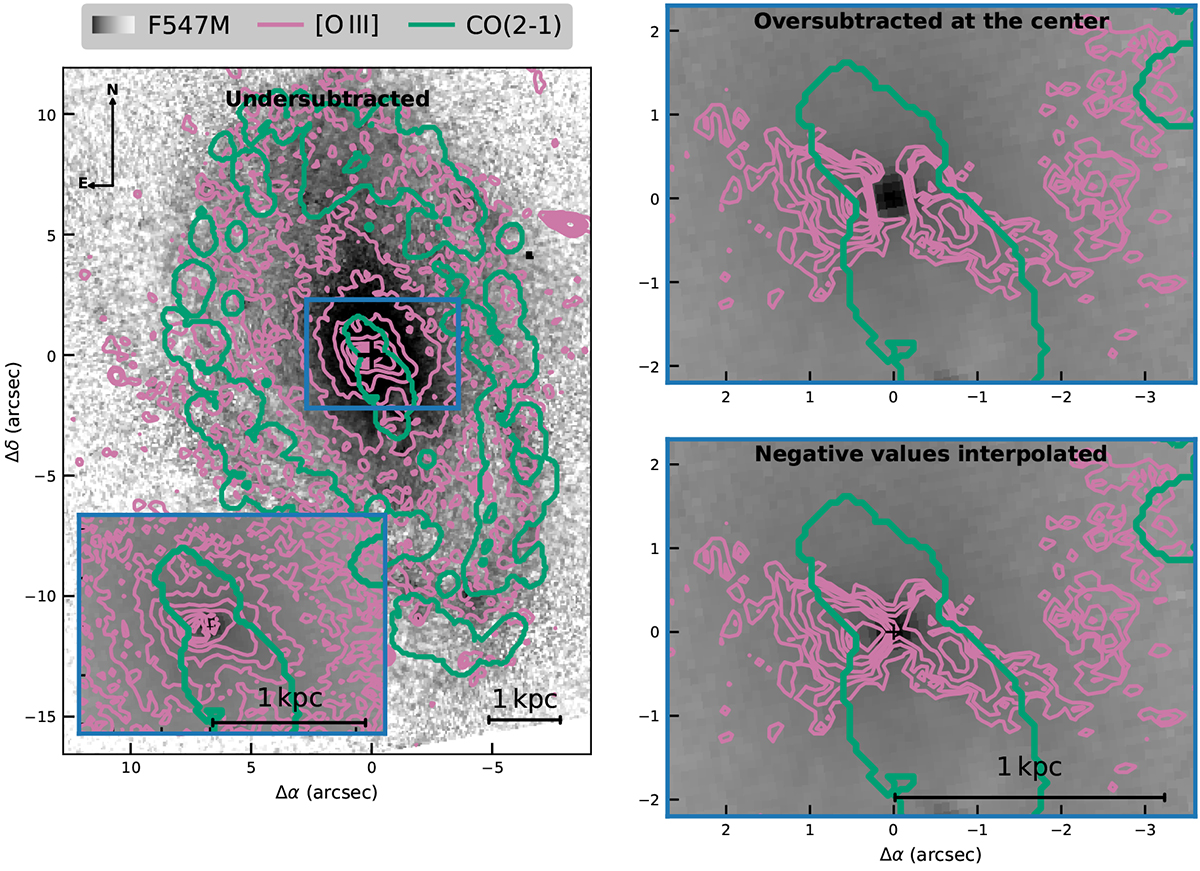
Fig. B.1.
Download original image
The effect on the [O III] flux distribution (reddish-purple contours) when the HST F547M optical continuum image (in grayscale) is multiplied by different factors before the subtraction from the FR533N image (narrow band filter covering [O III]). In the left, the continuum F547M was undersubtracted from [O III] – using a lower multiplicative factor – to avoid negative values are the center, with the inset showing a zoom-in in the central region. Notice that the smoothed [O III] contours follow the extended continuum distribution in this case. On the right, the continuum was subtracted using a larger factor that resulted in negative values at the center (upper map). For the final image, the [O III] image was interpolated to eliminate the negative values (lower map). To show that the spatial anticorrelation between CO and [O III] is visible in both maps, we added a single blueish-green contour, delineating the CO(2-1) flux distribution. In all zoom-in images, the F547M grayscale range is different maps to highlight the peak in the F547M image.
Current usage metrics show cumulative count of Article Views (full-text article views including HTML views, PDF and ePub downloads, according to the available data) and Abstracts Views on Vision4Press platform.
Data correspond to usage on the plateform after 2015. The current usage metrics is available 48-96 hours after online publication and is updated daily on week days.
Initial download of the metrics may take a while.