Open Access
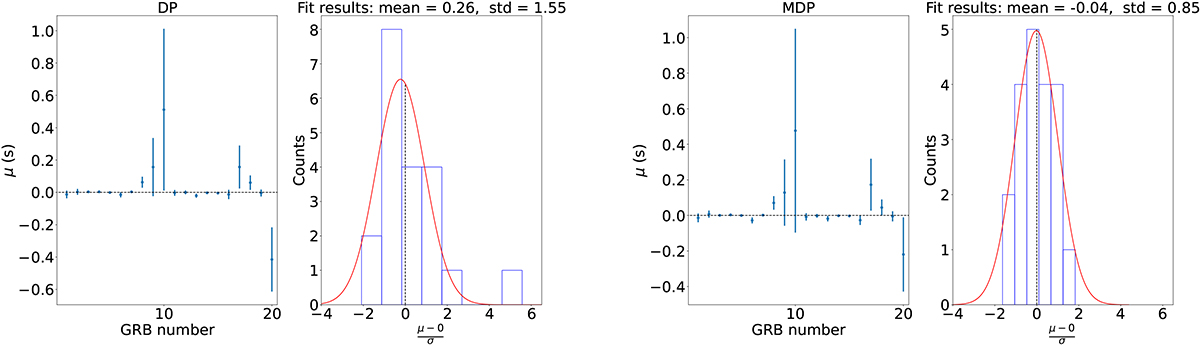
Fig. 10.
Download original image
Comparison of DP and MDP methods. Left panels: Experimental delays estimated via MC procedures with associated errors shown as vertical error bars. Right panels: Residual distribution for each method in units of sigma.
Current usage metrics show cumulative count of Article Views (full-text article views including HTML views, PDF and ePub downloads, according to the available data) and Abstracts Views on Vision4Press platform.
Data correspond to usage on the plateform after 2015. The current usage metrics is available 48-96 hours after online publication and is updated daily on week days.
Initial download of the metrics may take a while.