Fig. E.1.
Download original image
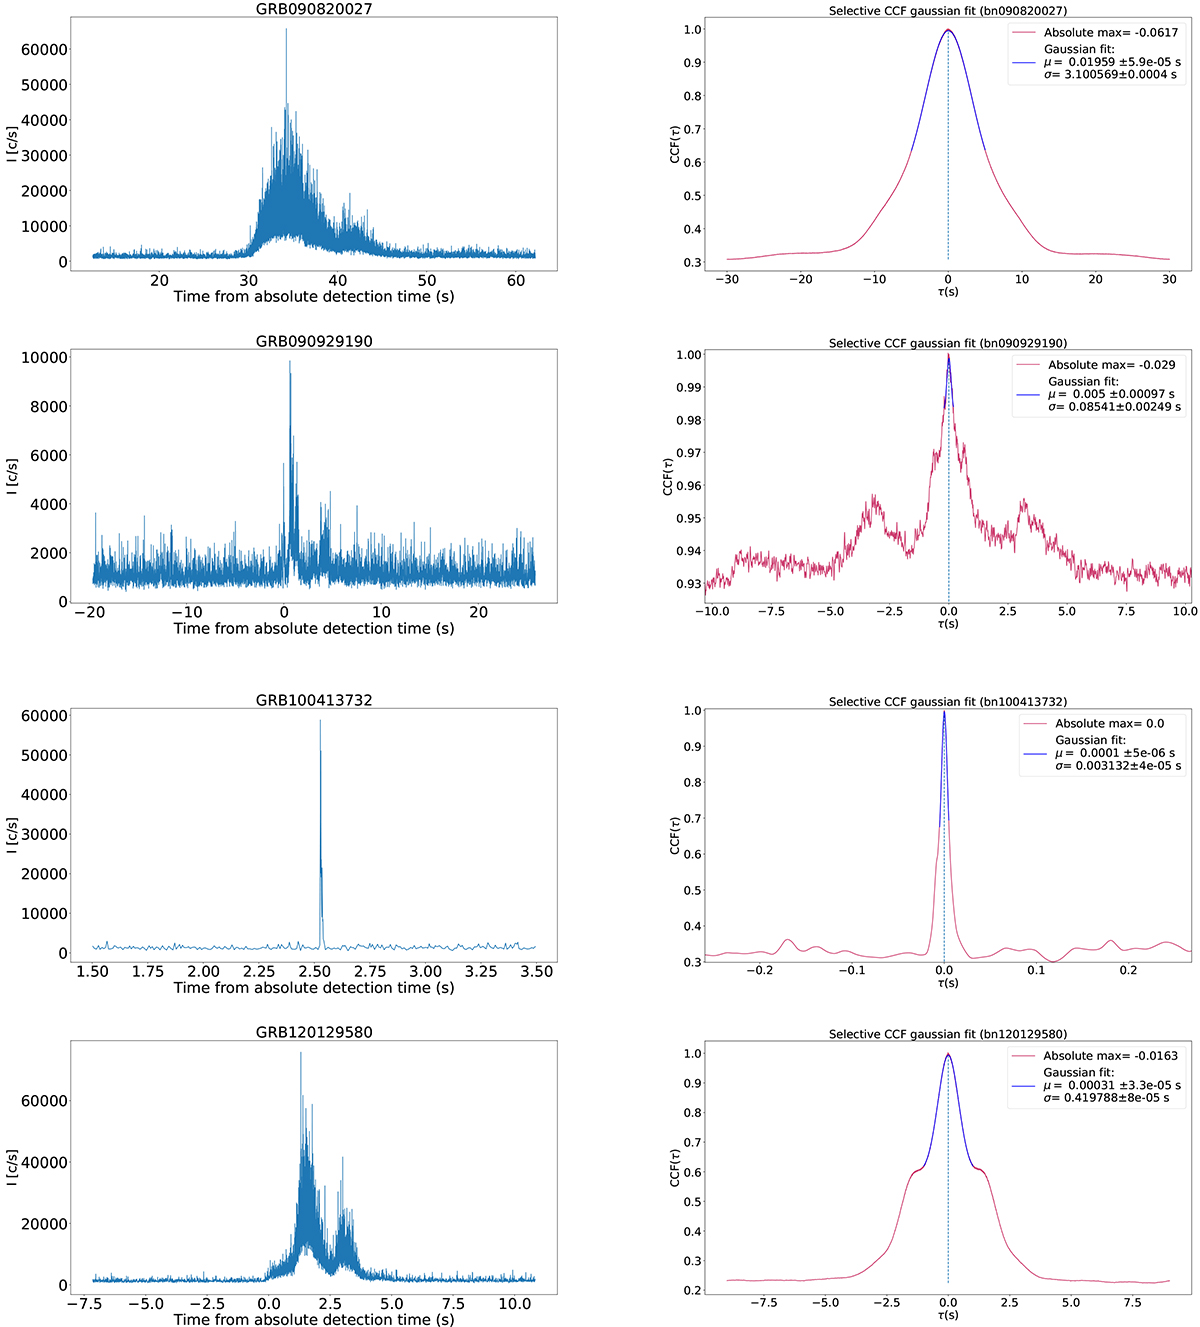
Right panel: Example CCFs performed between ToA lists (see subsection: 2.4) obtained via the MDP method (see subsection: 4.3). Gaussian fit parameters are highlighted in each plot and fixed for both the MDP and the DP methods testing (see subsection: 5). ToA lists are retrieved from GRB data as observed by the brightest Fermi-GBM detector monitoring the bursts. Left panel: Light curves from the brightest detector, computed using an adaptive bin size of 10 photons per bin.
Current usage metrics show cumulative count of Article Views (full-text article views including HTML views, PDF and ePub downloads, according to the available data) and Abstracts Views on Vision4Press platform.
Data correspond to usage on the plateform after 2015. The current usage metrics is available 48-96 hours after online publication and is updated daily on week days.
Initial download of the metrics may take a while.