Fig. 3.
Download original image
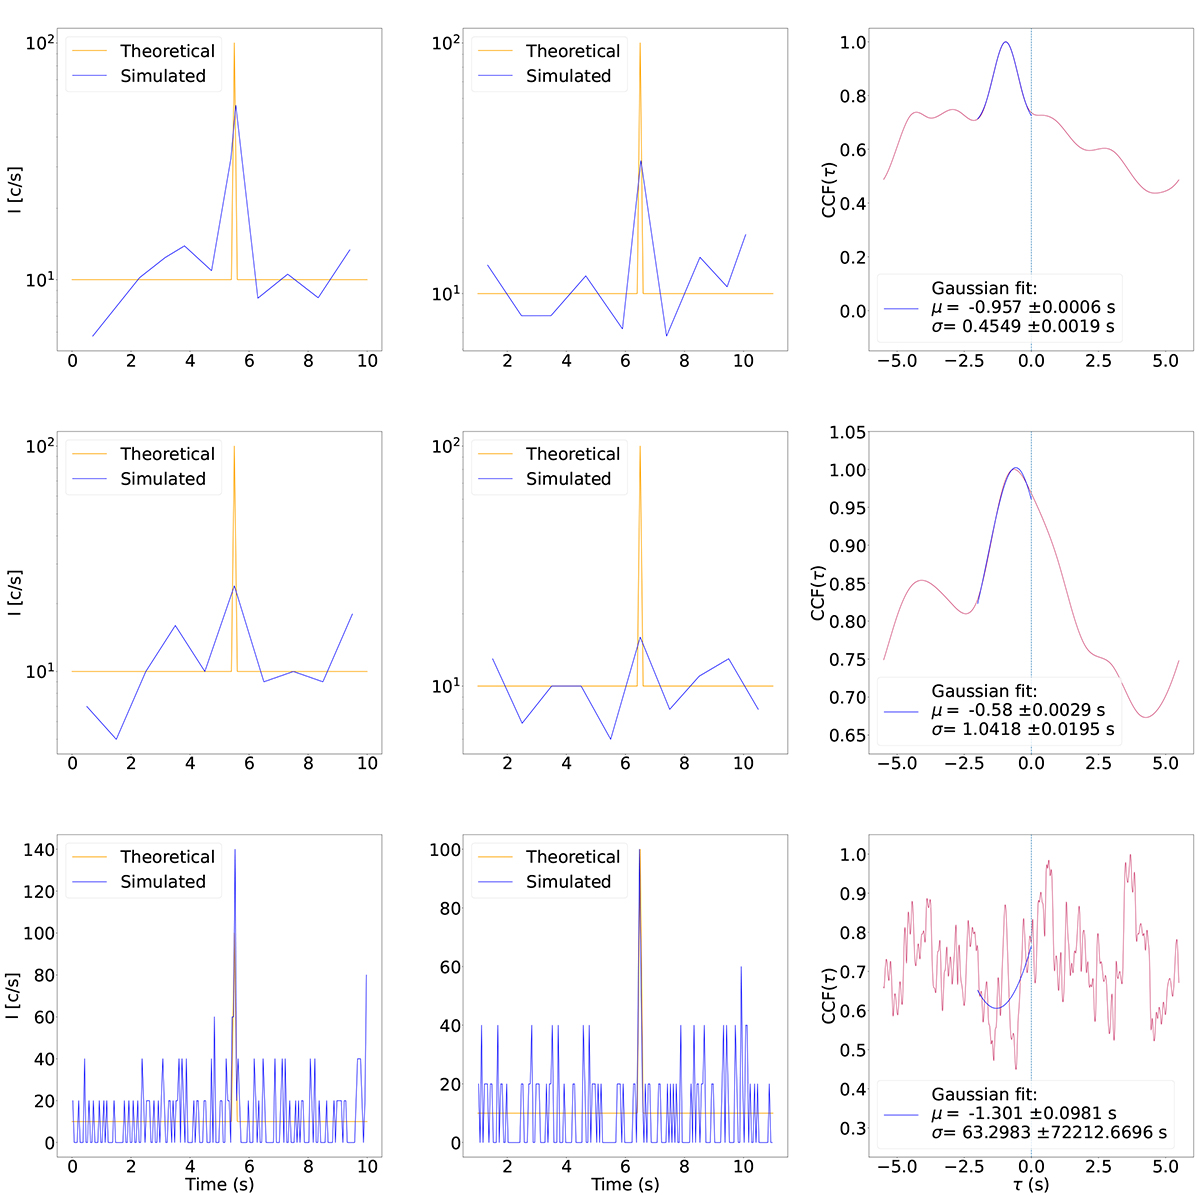
Top row: Light curves (left and central panels) and corresponding CCF (right panel) obtained using the adaptive rebinning method (10 photons per bin). Middle and bottom rows: Same configuration, but using fixed bin sizes of 1 s and 0.05 s, respectively. In each row, the left panel shows in blue the simulated signal obtained by rebinning the ToA list generated by simulating the theoretical profile shown in orange. The center panel displays the same signal, delayed by 1 s before rebinning. The right panel presents the CCF between the two simulated light curves shown in the left and central panels of the corresponding row.
Current usage metrics show cumulative count of Article Views (full-text article views including HTML views, PDF and ePub downloads, according to the available data) and Abstracts Views on Vision4Press platform.
Data correspond to usage on the plateform after 2015. The current usage metrics is available 48-96 hours after online publication and is updated daily on week days.
Initial download of the metrics may take a while.