Open Access
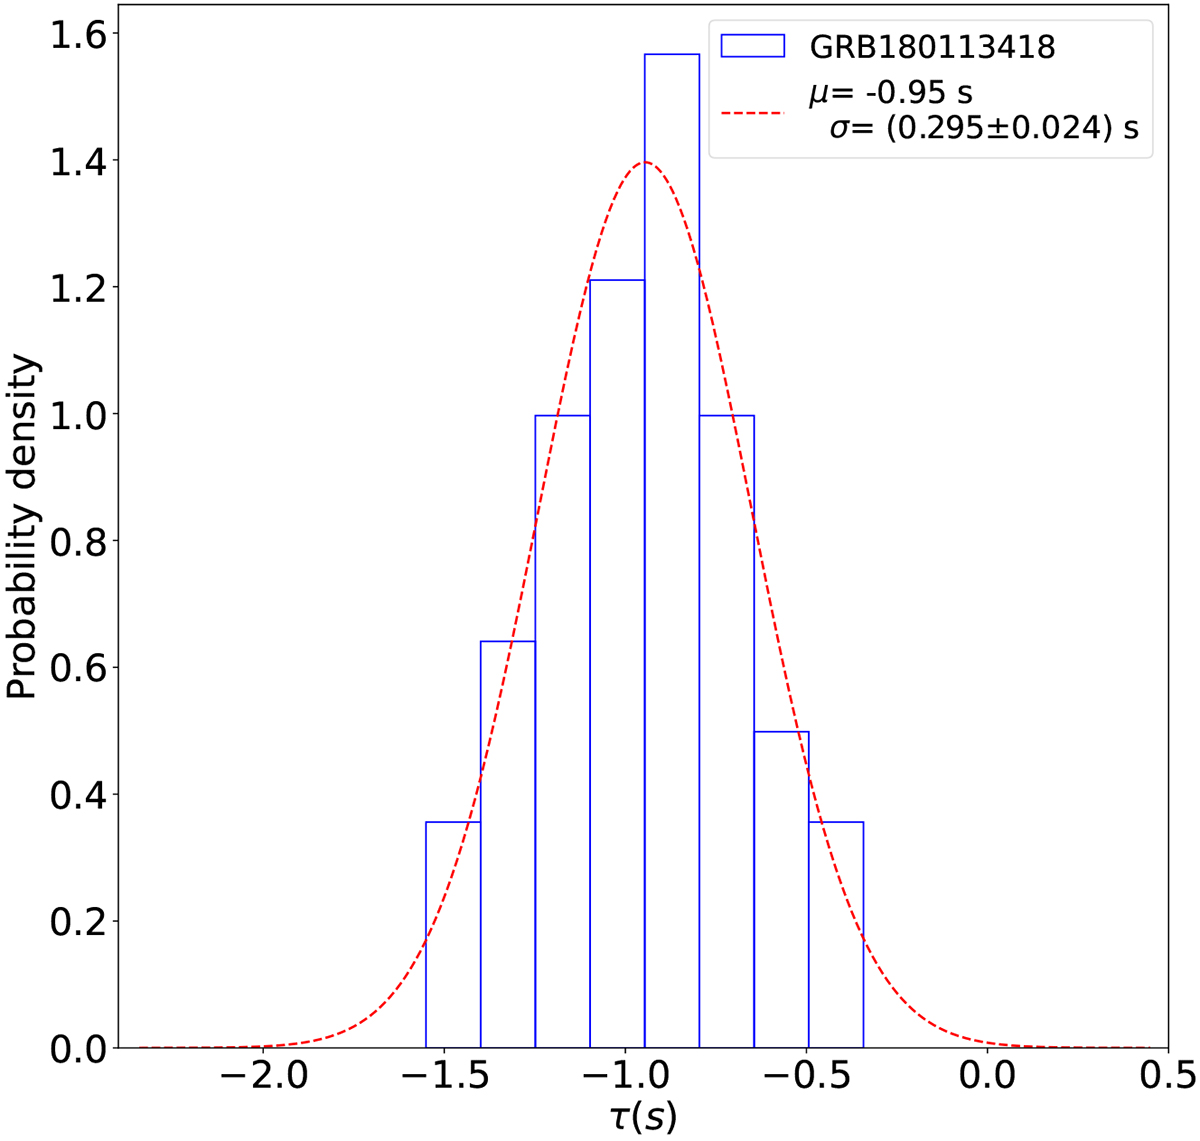
Fig. 8.
Download original image
Delay distribution is obtained by cross-correlating 100 pairs of ToA lists, derived from the random division of the GRB 180113418 event file. A 1-second delay is injected into one of the ToA lists in each pair.
Current usage metrics show cumulative count of Article Views (full-text article views including HTML views, PDF and ePub downloads, according to the available data) and Abstracts Views on Vision4Press platform.
Data correspond to usage on the plateform after 2015. The current usage metrics is available 48-96 hours after online publication and is updated daily on week days.
Initial download of the metrics may take a while.