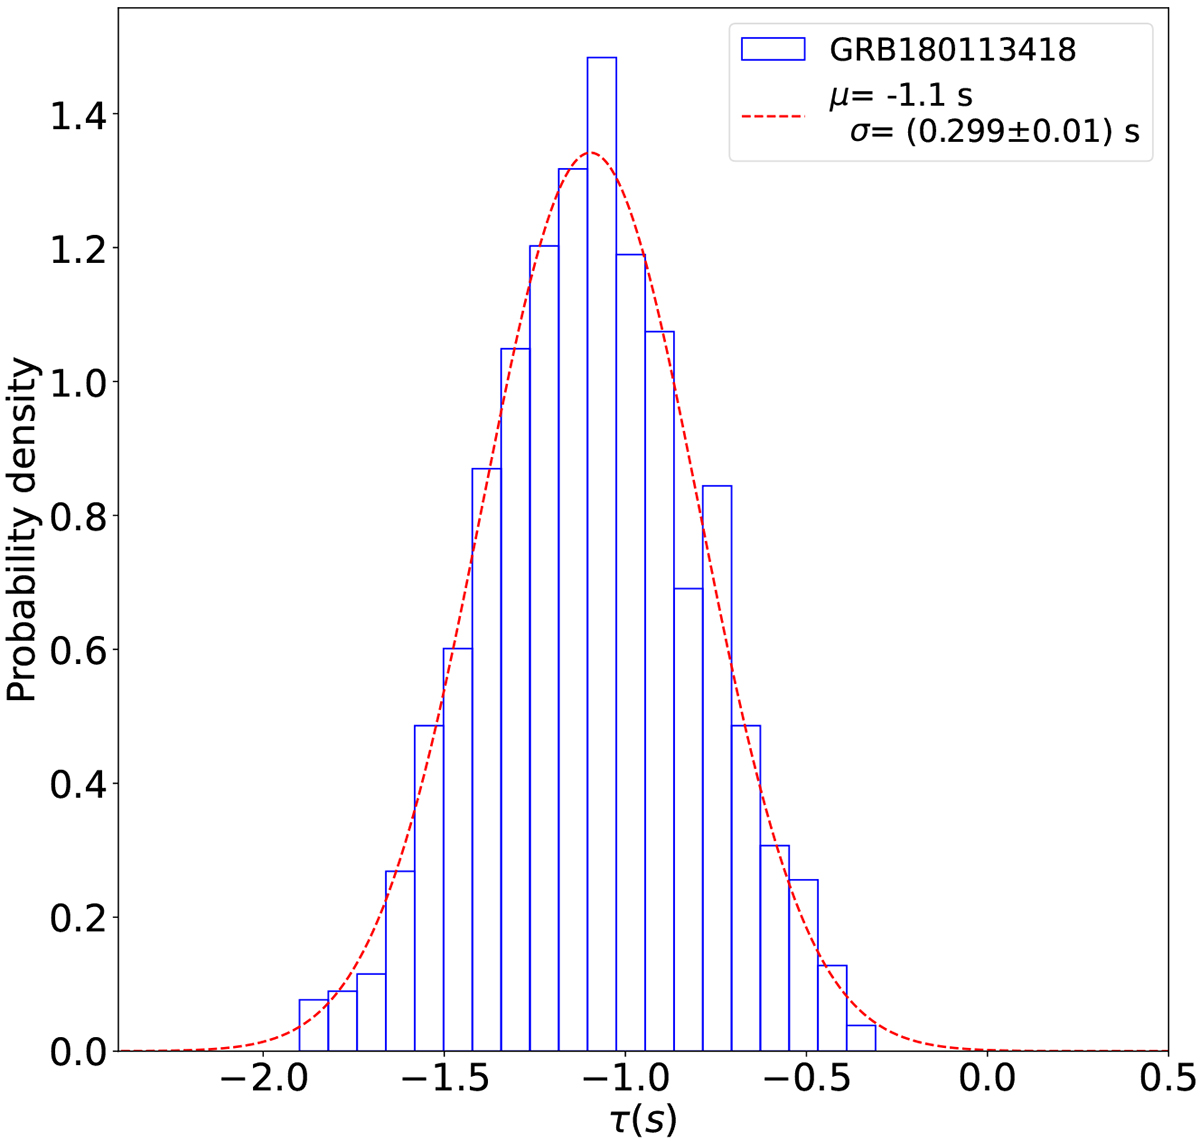
Fig. 9.
Download original image
Delay distribution obtained by applying the MDP method to two of the 200 ToA lists derived from the random division of the GRB 180113418 event file. A 1-second delay is introduced into one ToA list. The MDP procedure is carried out by randomly splitting the initial ToA lists 500 times, resulting in two pools of 1000 light curves each.
Current usage metrics show cumulative count of Article Views (full-text article views including HTML views, PDF and ePub downloads, according to the available data) and Abstracts Views on Vision4Press platform.
Data correspond to usage on the plateform after 2015. The current usage metrics is available 48-96 hours after online publication and is updated daily on week days.
Initial download of the metrics may take a while.